
DNA Methylation Data Analysis
Introduction
DNA Methylation is essentially a epigenetic mechanism to orchestrate genes' expression in a cell. As the name suggests, it refers to the addition of a methyl (CH3) group to DNA nucleotides. This effect has various renditions and could be attributed to the normal or a tweaked phenotype. The most venerable methylation phenomena is the covalent addition of the methyl group at the 5-carbon of the cytosine ring resulting in 5-methylcytosine (5-mC), effectively inhibiting transcription. Contrarily, there is DNA demethylation that is the removal of methyl group from the DNA. This process too has some pertinent effects. A brief perusal of the topic could be found here . In the current exercise, we shall be handling bisulphite sequencing data. Bisulphite sequencing is the treatment of DNA before the routine sequencing tasks.

Data
This exercise is based on the study bt Lin et al. 2015 [1], the data for which is available here . In consideration to the time for this workshop, the data will be a subset of the original data. But we get the due essence of the overall analysis.
Tools
We shall be ascertaining the quality of the data with FASTQC. A reckoner for the same is available here . We shall also be using the bwameth for mapping the bisulphite-sequencing data against the reference genome. Further we shall use MethylDackel ('pileometh' formerly) to elaborate on the methylation status. Also, a tutorial for installation of tools in Galaxy can be found here .
Let us download the files subset_1.fastq and subset_2.fastq from the link provided above and remove the file extension via renaming.
Exercise
- Run FASTQC on both the reads and examine the quality parameters.
Next, we move towards aligning these paired-end reads to the reference genome. In this case we need to load the Homo sapiens genome version hg38 . Although, the genomes can be added to the local instance of the Galaxy (See example ), should it require due to network or processing caveats, there is always an option to manually download the sequence file for the genome and add to the history, for further alignment processing. For a change of flavor, let us try the latter.
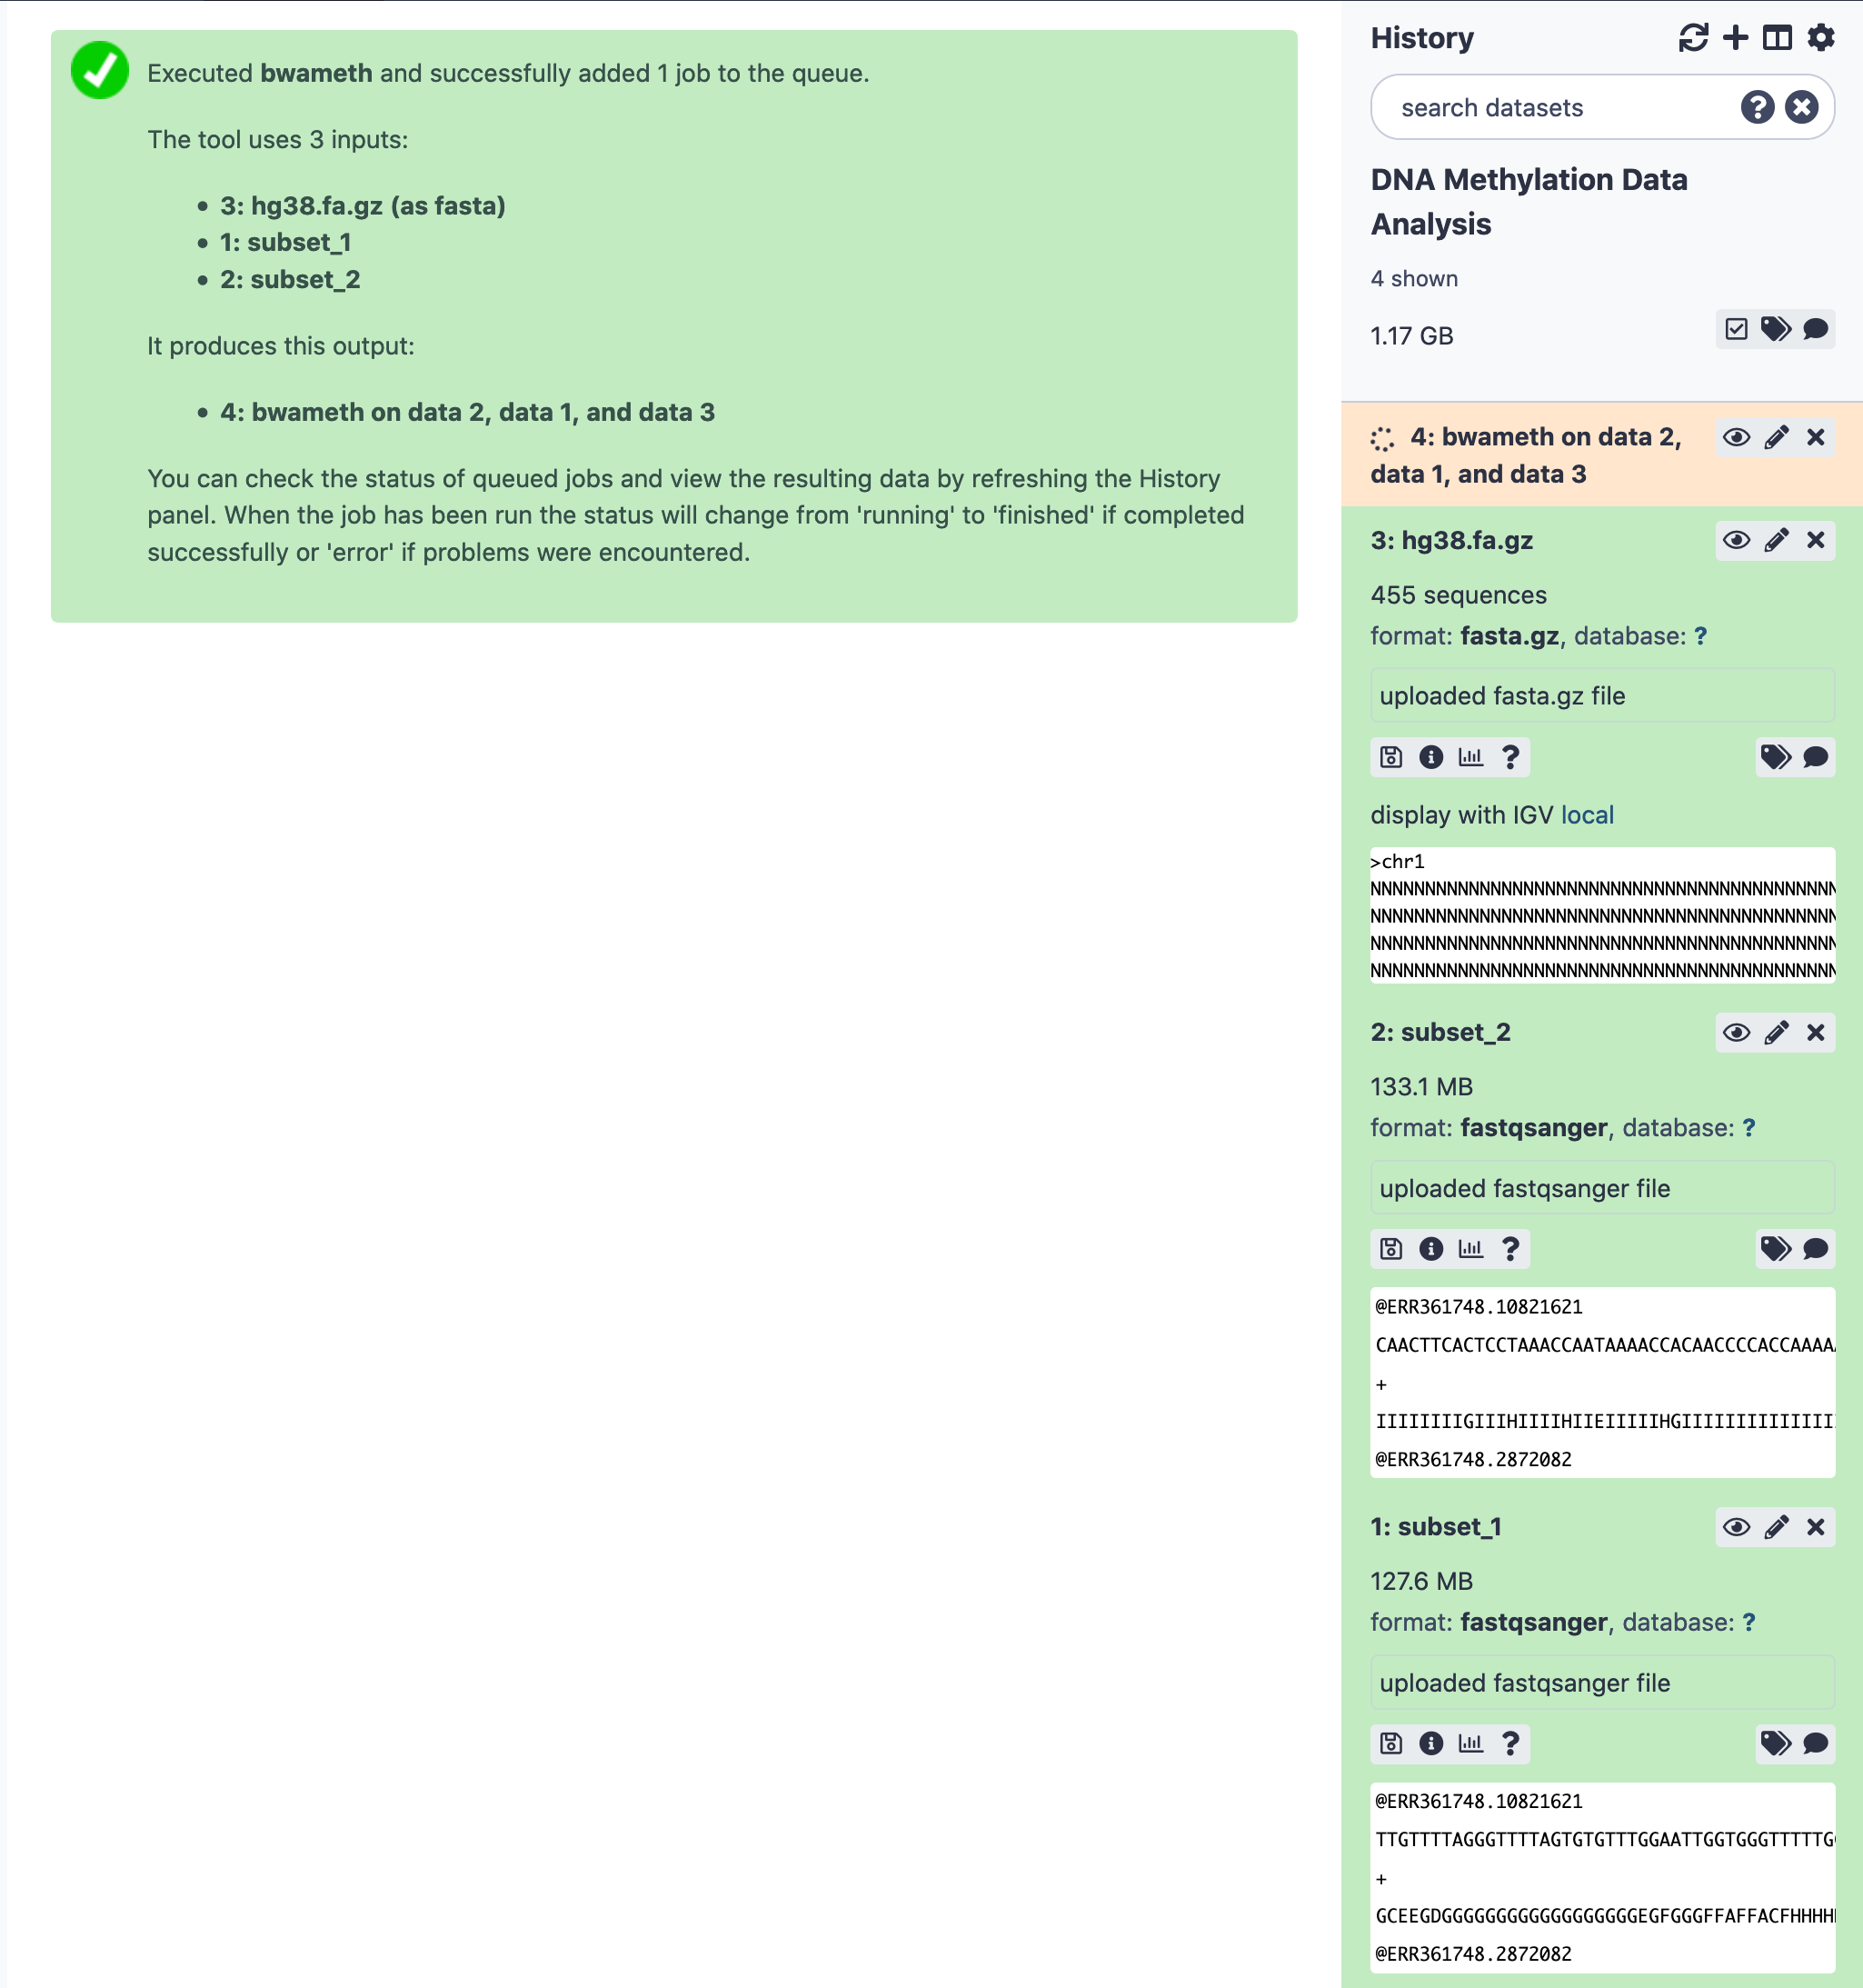
Since the genome is manually added to the history, the indicies are not available. The bwameth run will go an extra mile to build indicies first and then complete the alignment task. This certainly takes longer than expected.
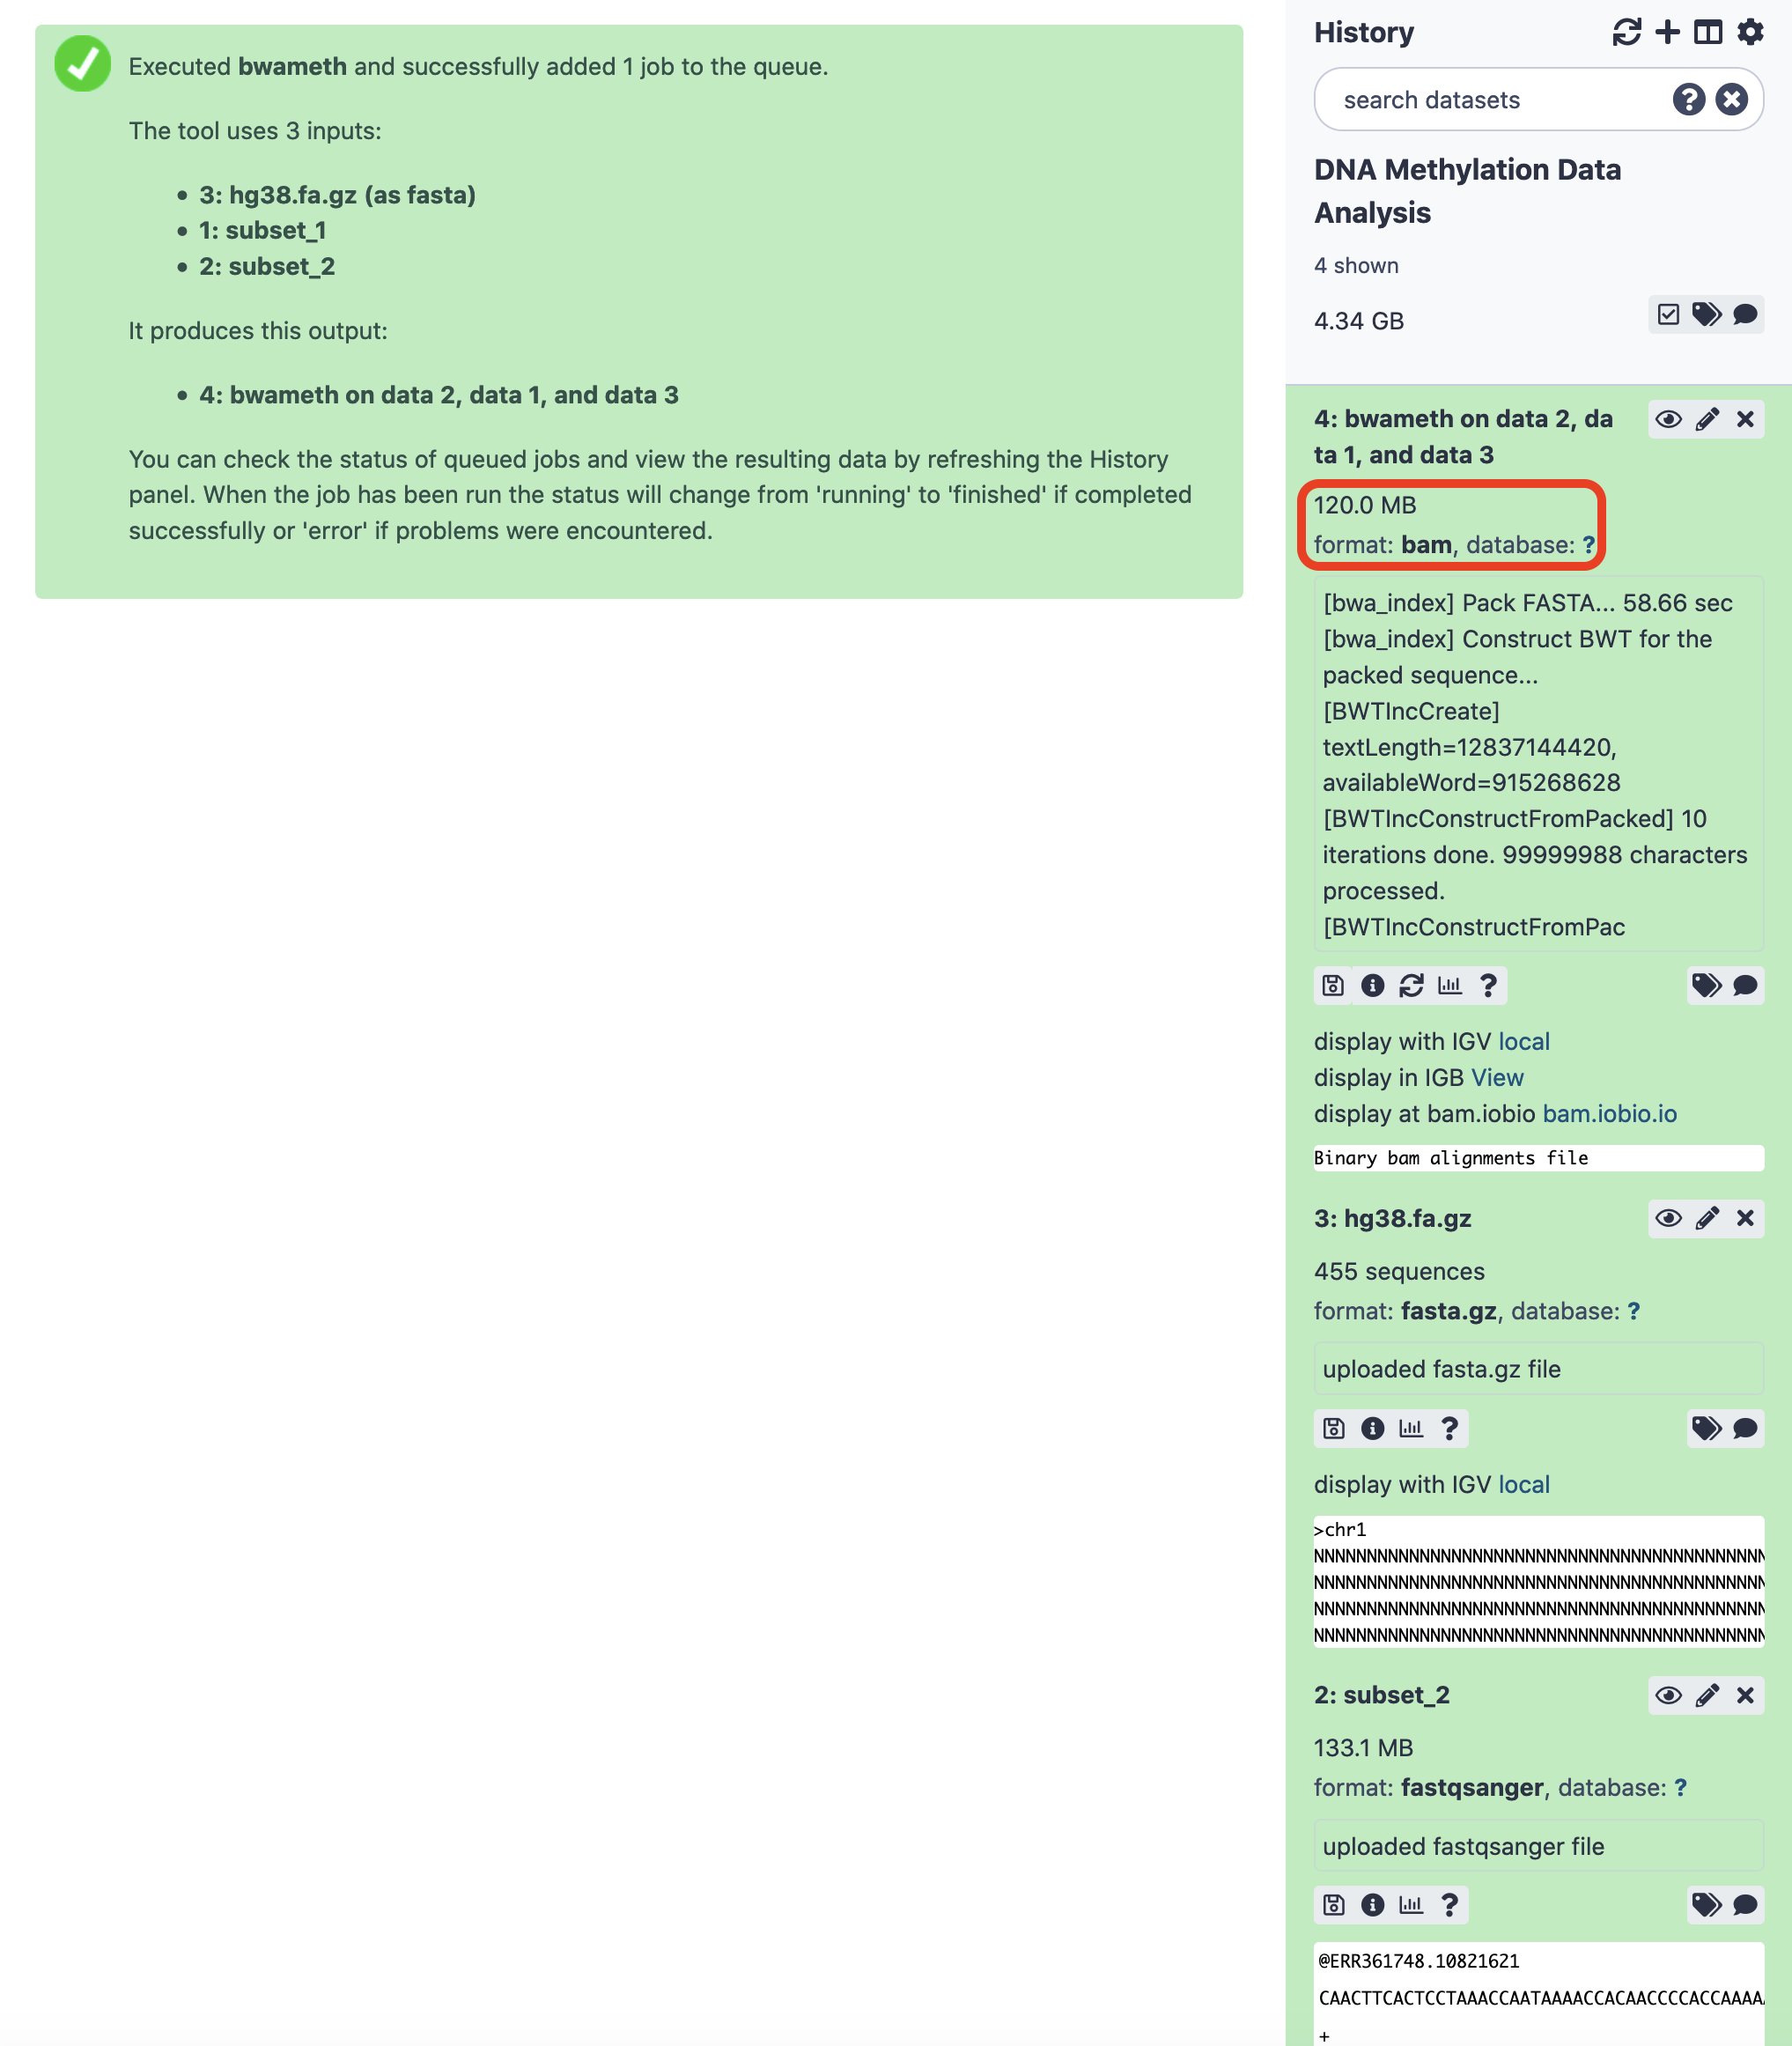
After the successful execution, an alignment file (BAM) is delivered. We would surely like to explore the methylation features. MethylDackel comes to our rescue here.
Select the options as below, leaving other parameters as-is, and execute the tool.
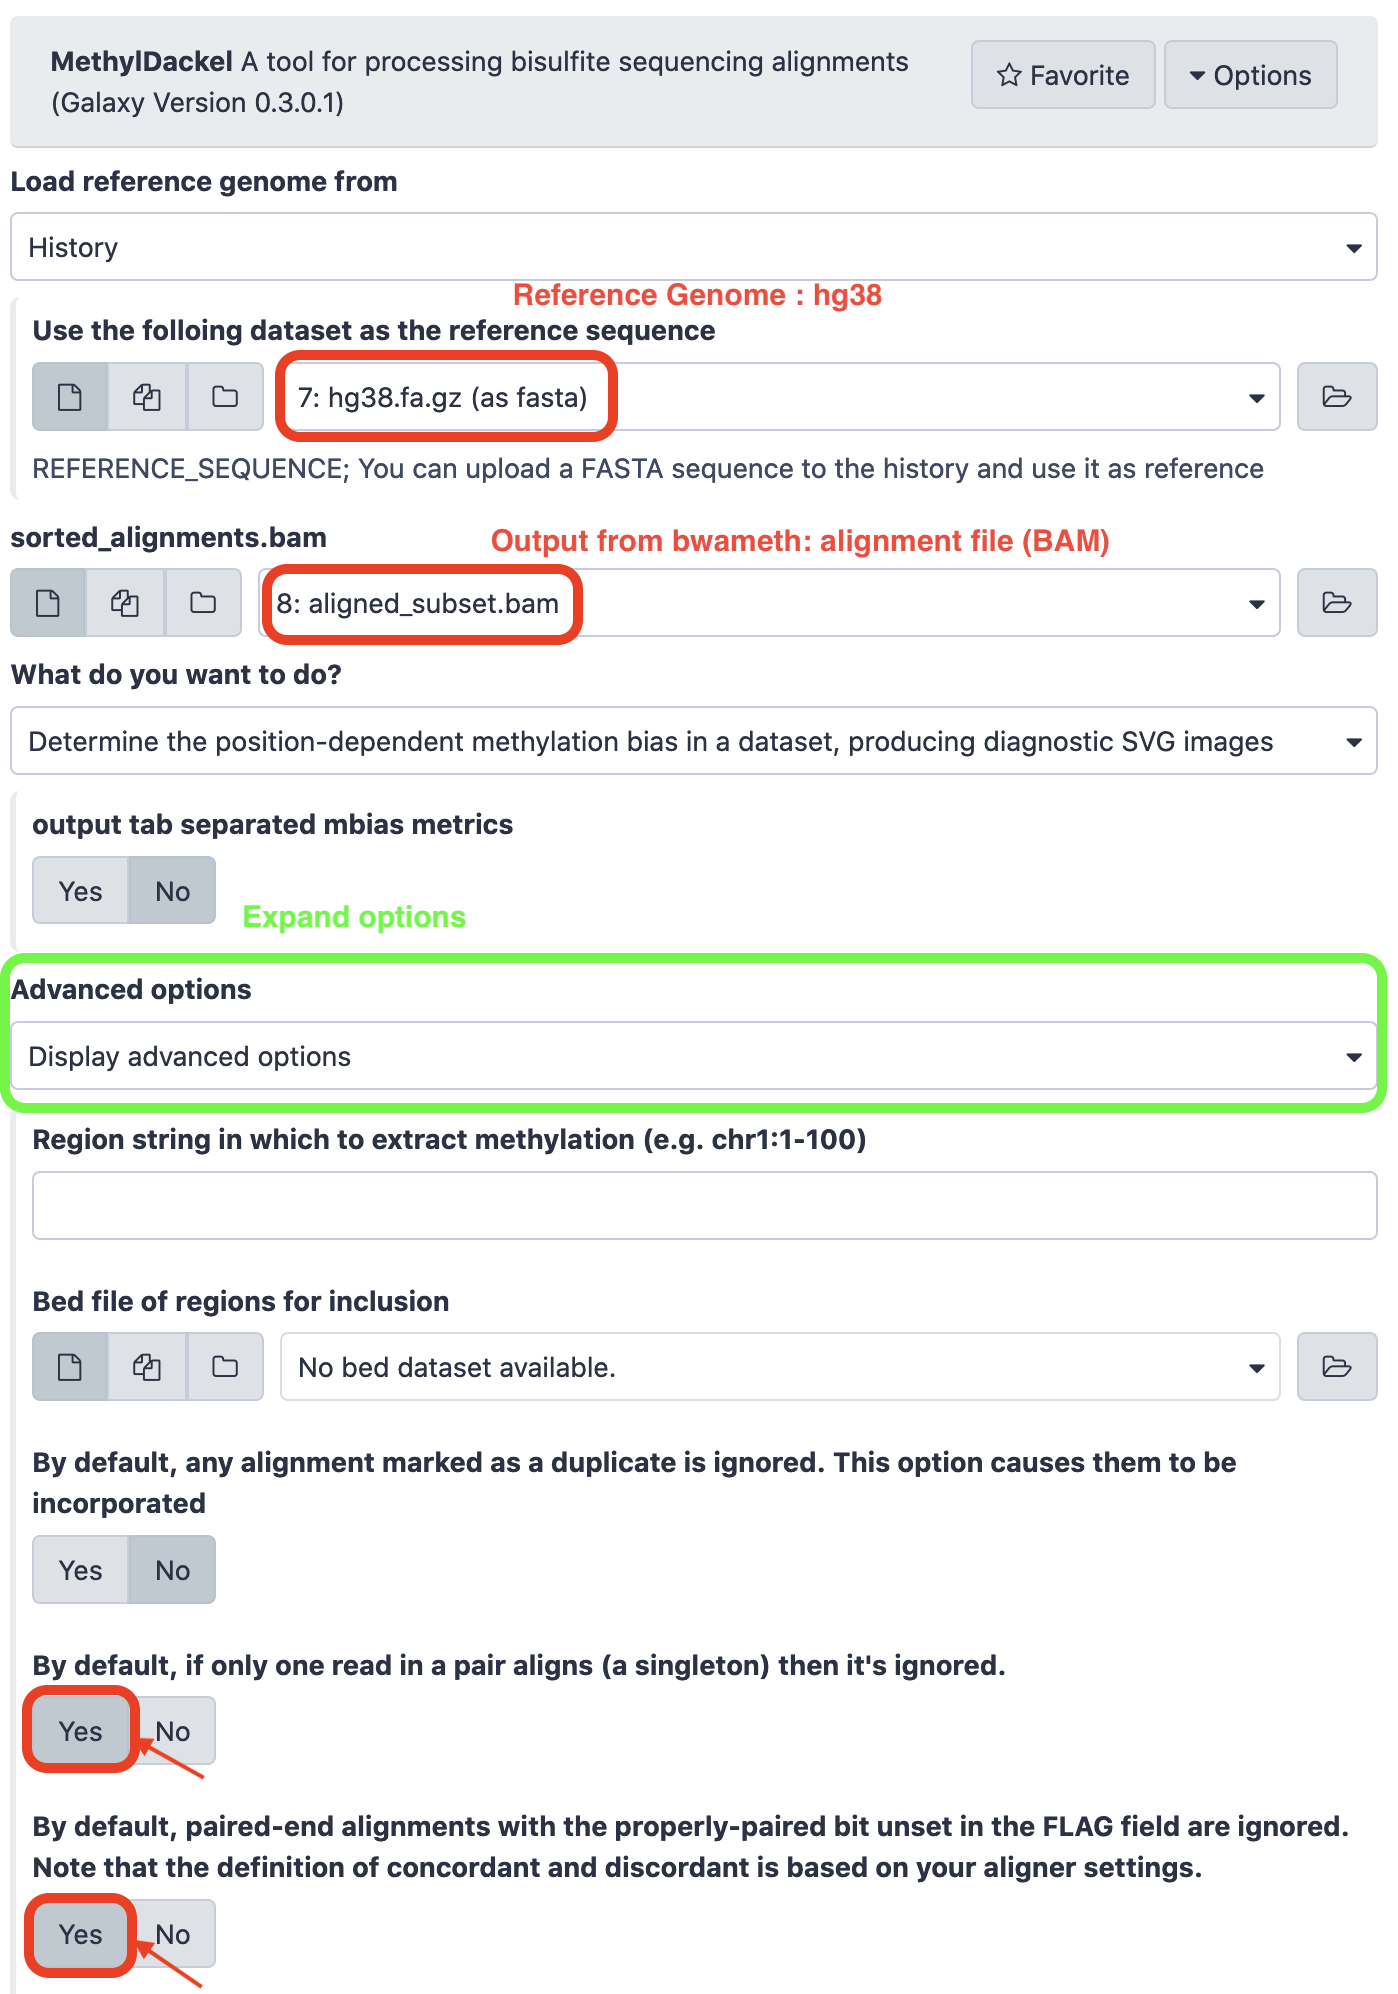
P.S. The alignment file has been renamed to “aligned_subset.bam” and re-loaded to the Galaxy instance.
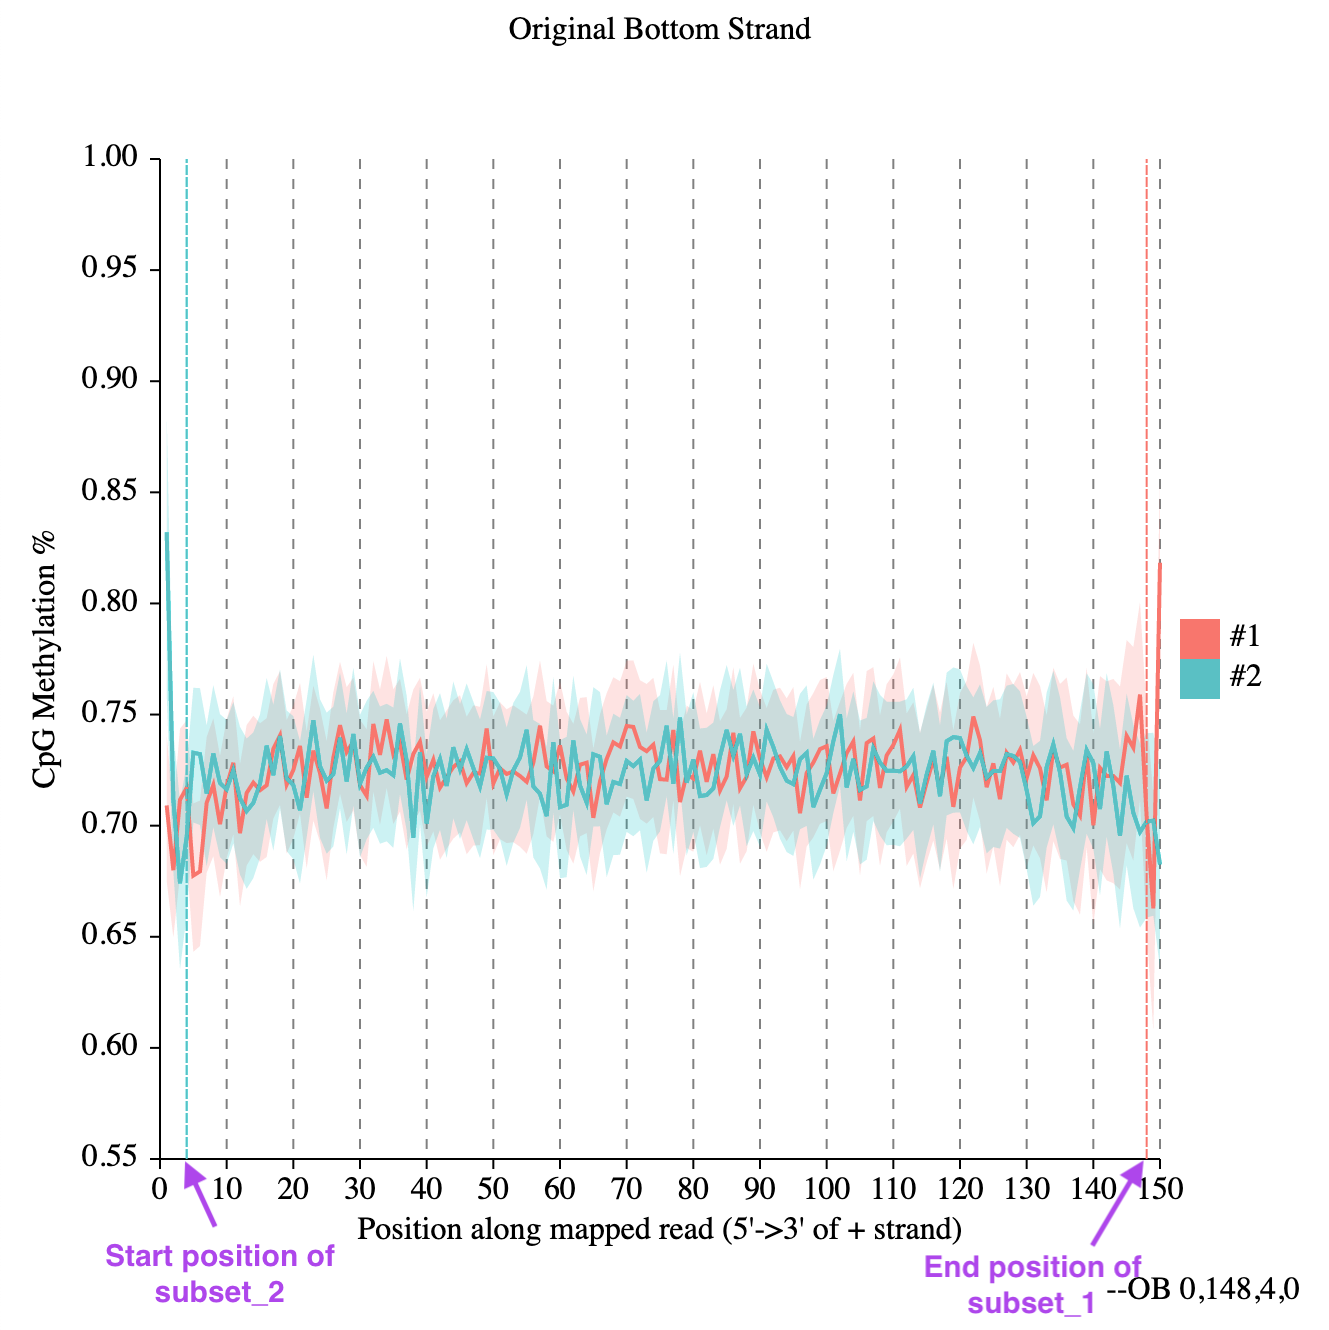
The output will be four distinct plots that will depict CpG methylation percentage along the read length. Let us pick up one for the "Original Bottom Strand" for contemplation.

The figure shows almost symmetrical curves, with a slight pronounced jitter at the edges. If it is a concern, one could plan on trimming the ends of the reads considering appropriate positions.
For plotting methylation levels, we will use MethylDackel again with the following input parameters.
- Load reference genome: Local cache
- Using reference genome: hg38
- sorted_alignments.bam: the computed bam file of step 4 of the bwameth alignment.
- What do you want to do?: Extract methylation metrics from an alignment file in BAM/CRAN format.
- Merge per-Cytosine metrics from CpG and CHG contexts into per-CPG or per-CHG metrics : Yes
- Extract fractional methylation (only) at each position. This is mutually exclusive with --counts, --logit, and --methylKit : Yes
- All other options use the default value.
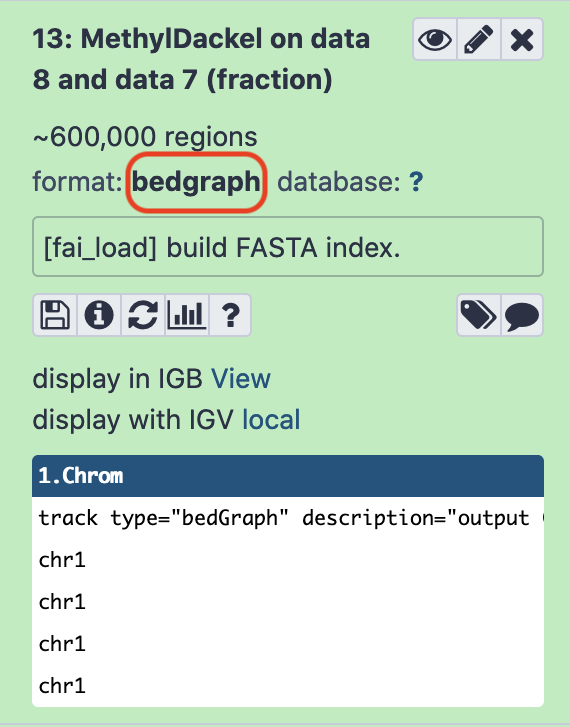
Finally, we have a bedgraph file that we can visualize.
Visualization
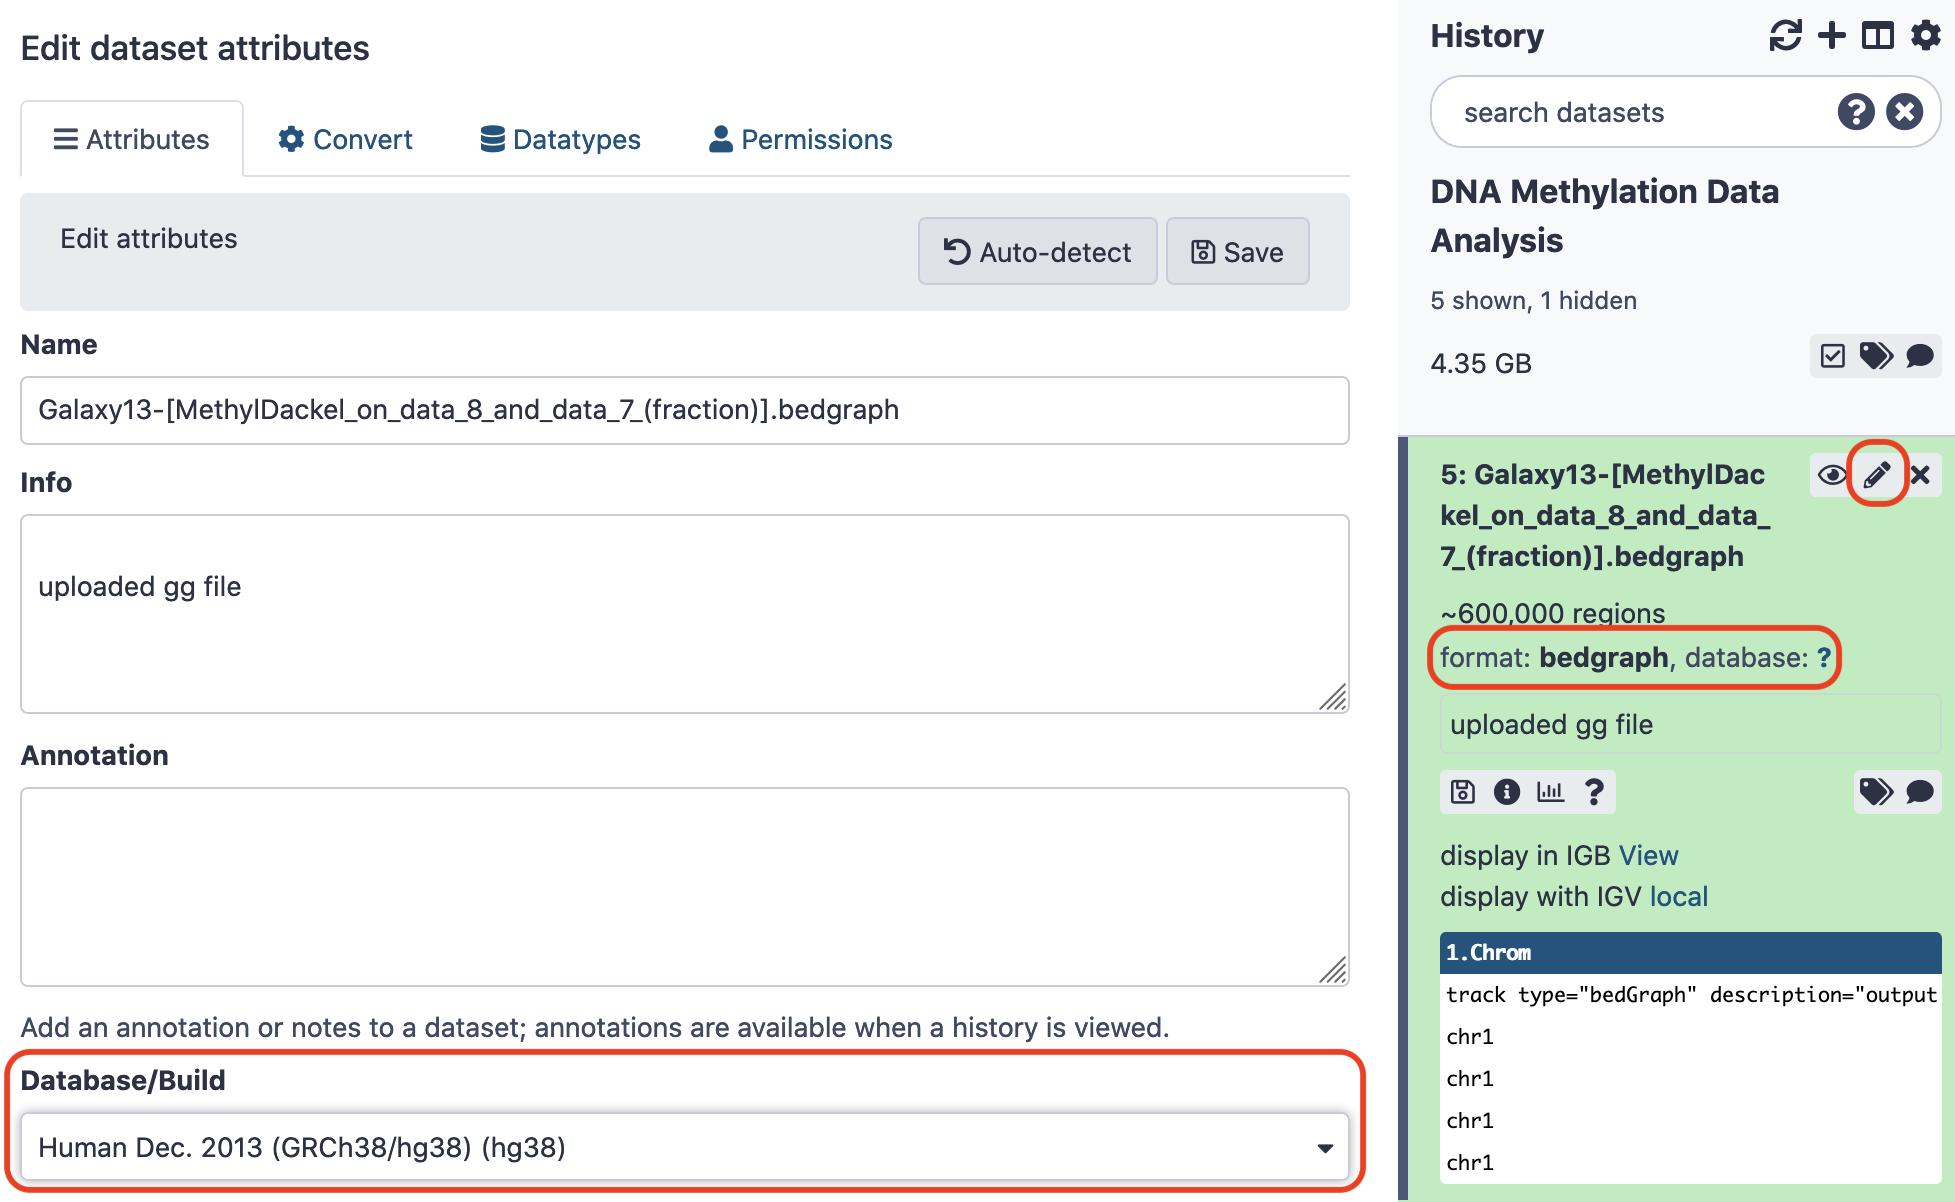
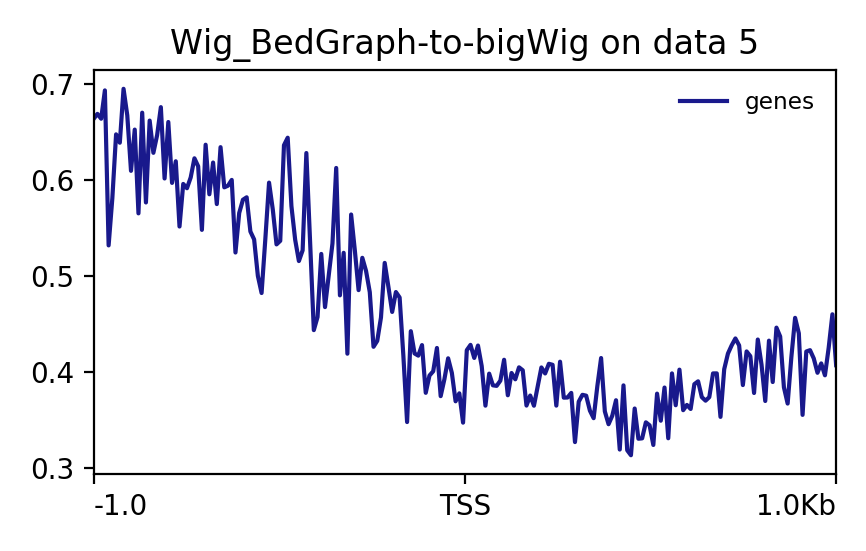
Here, we are going to visualize methylation profiles around all Transcription Start-Sites (TSS) of our data. (Note: DNA methylation at gene promoters usually represses the gene functioning). Please be watchful that the previous output might not be reflected as the input to the next tool we're going to use. To ensure it does, change the attributes of the file to match- first, the datatype being bedgraph, and second, the database/ build being Human Dec. 2013 (GRCh38/hg38) (hg38) . To proceed install the tool Wig/BedGraph-to-bigWig converter from the repository ucsc-wigtobigwig and convert the bedgraph format to bigwig.
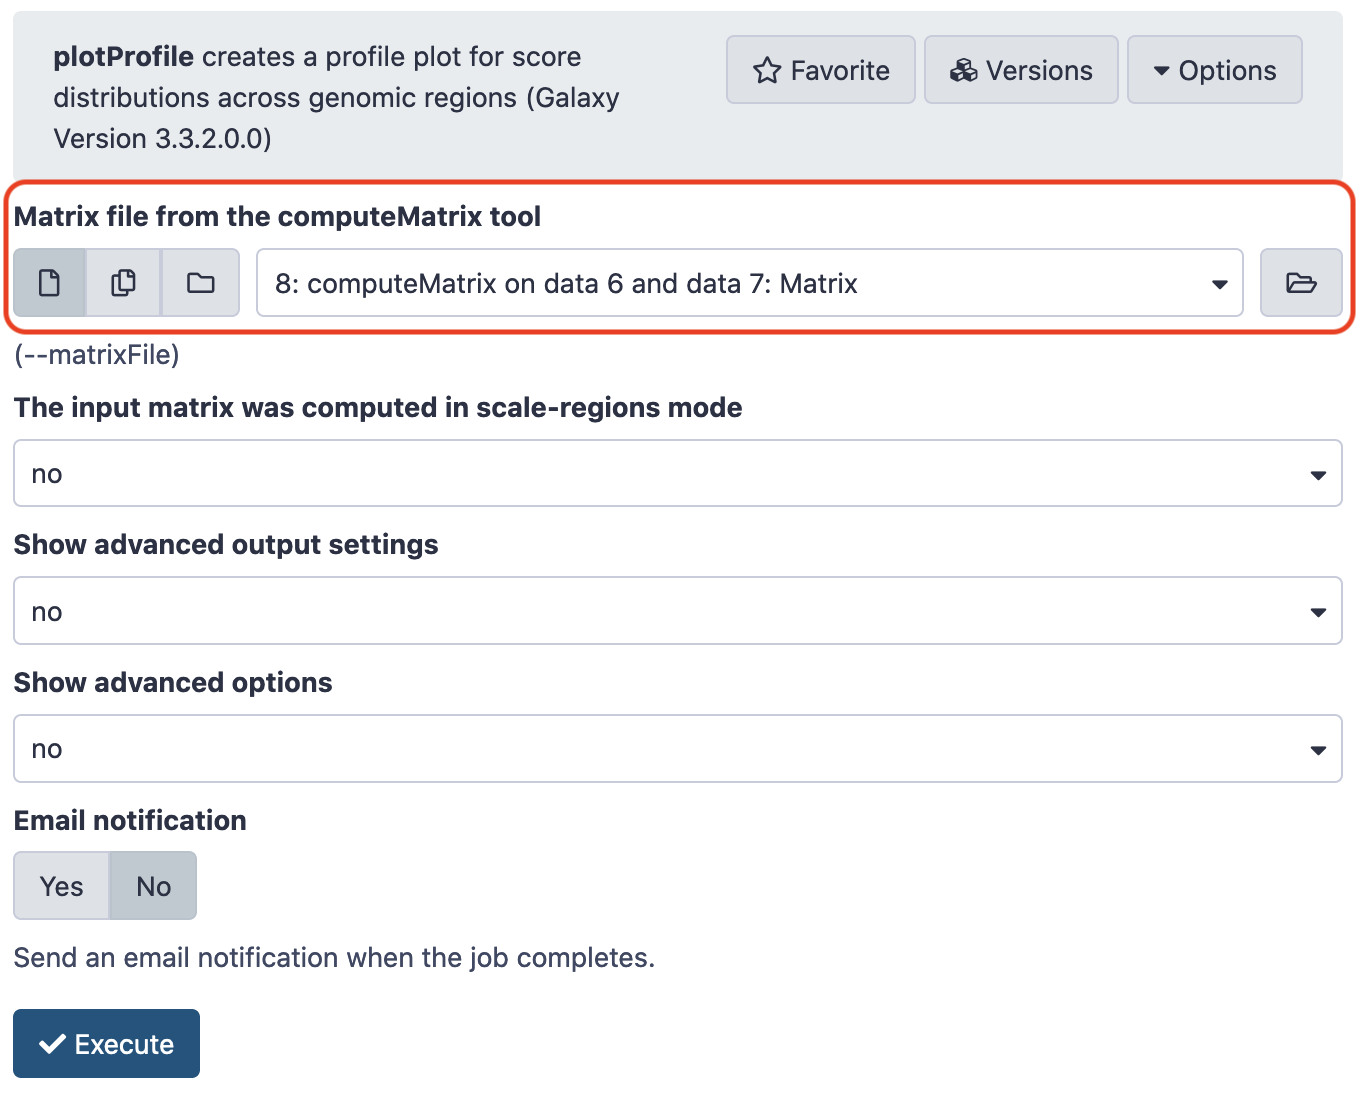
Next, we shall load the file CpGIslands.bed from the source and install deeptools_compute_matrix and deeptools_plot_profile . Use the following values for parameters and leave the rest as default. (P.S. The indexing of files might be inconsistent, as shown in the screenshots, as local and main Galaxy instances were used interchangeably as per accessibility.)

Next,
The final output looks like this. Note that the buffer regions of 1Kb on either side of the TSS can be manipulated as per the requirement.
Exercise
- There are several other bedgraph files available here . Choose anyone and repeat the same protocol of visualization. Analyze the results.
Differentially Methylated Regions
Another flavor of this analysis, and arguably more purposeful, is the elicitation of differentially methylated regions, that could possibly map the variegated methylation states. For the same, we shall use the tool metilene . More information on the tool is available here .
Install the said tool from the tool shed , download the following files from the repository mentioned previously, and upload them to the local Galaxy instance.
- NB1_CpG.meth.bedGraph
- NB2_CpG.meth.bedGraph
- BT198_CpG.meth.bedGraph
Note: Make sure that these files have appropriate datatypes, else the tool will not recognize them.
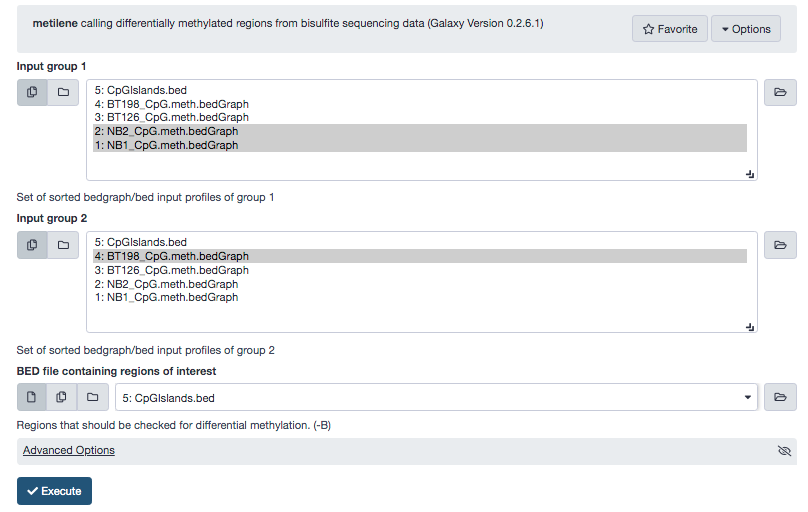
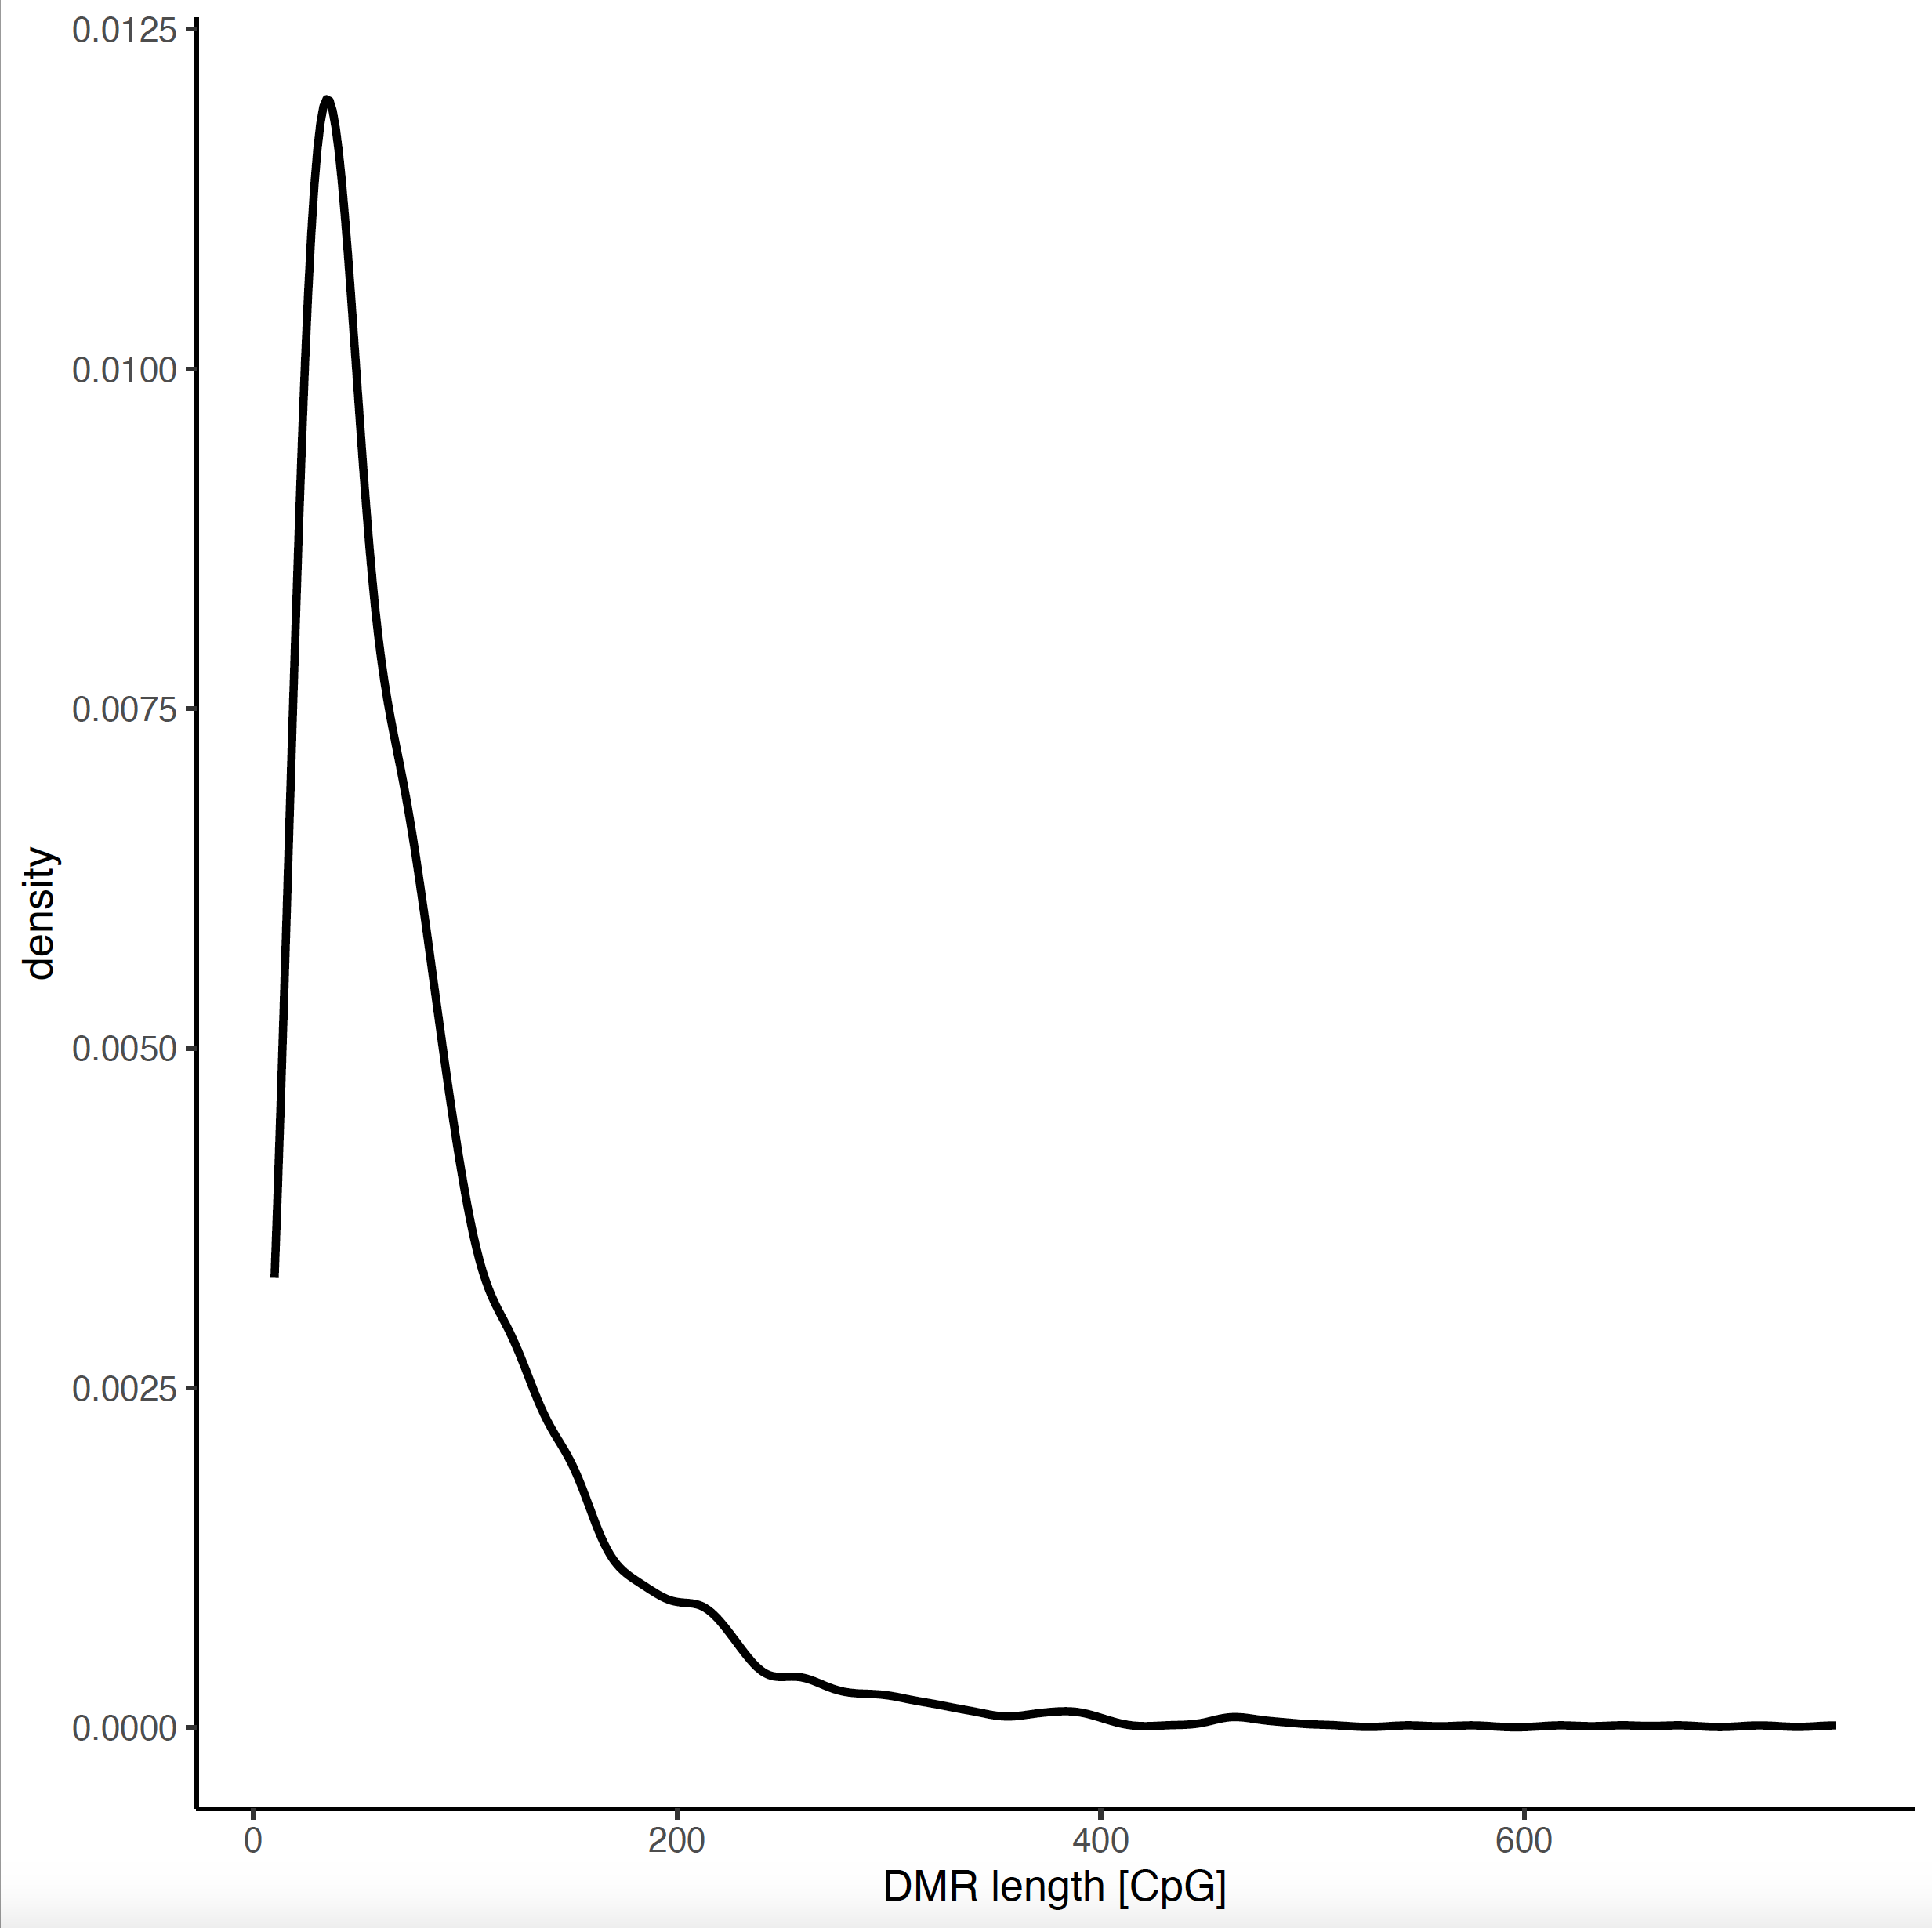
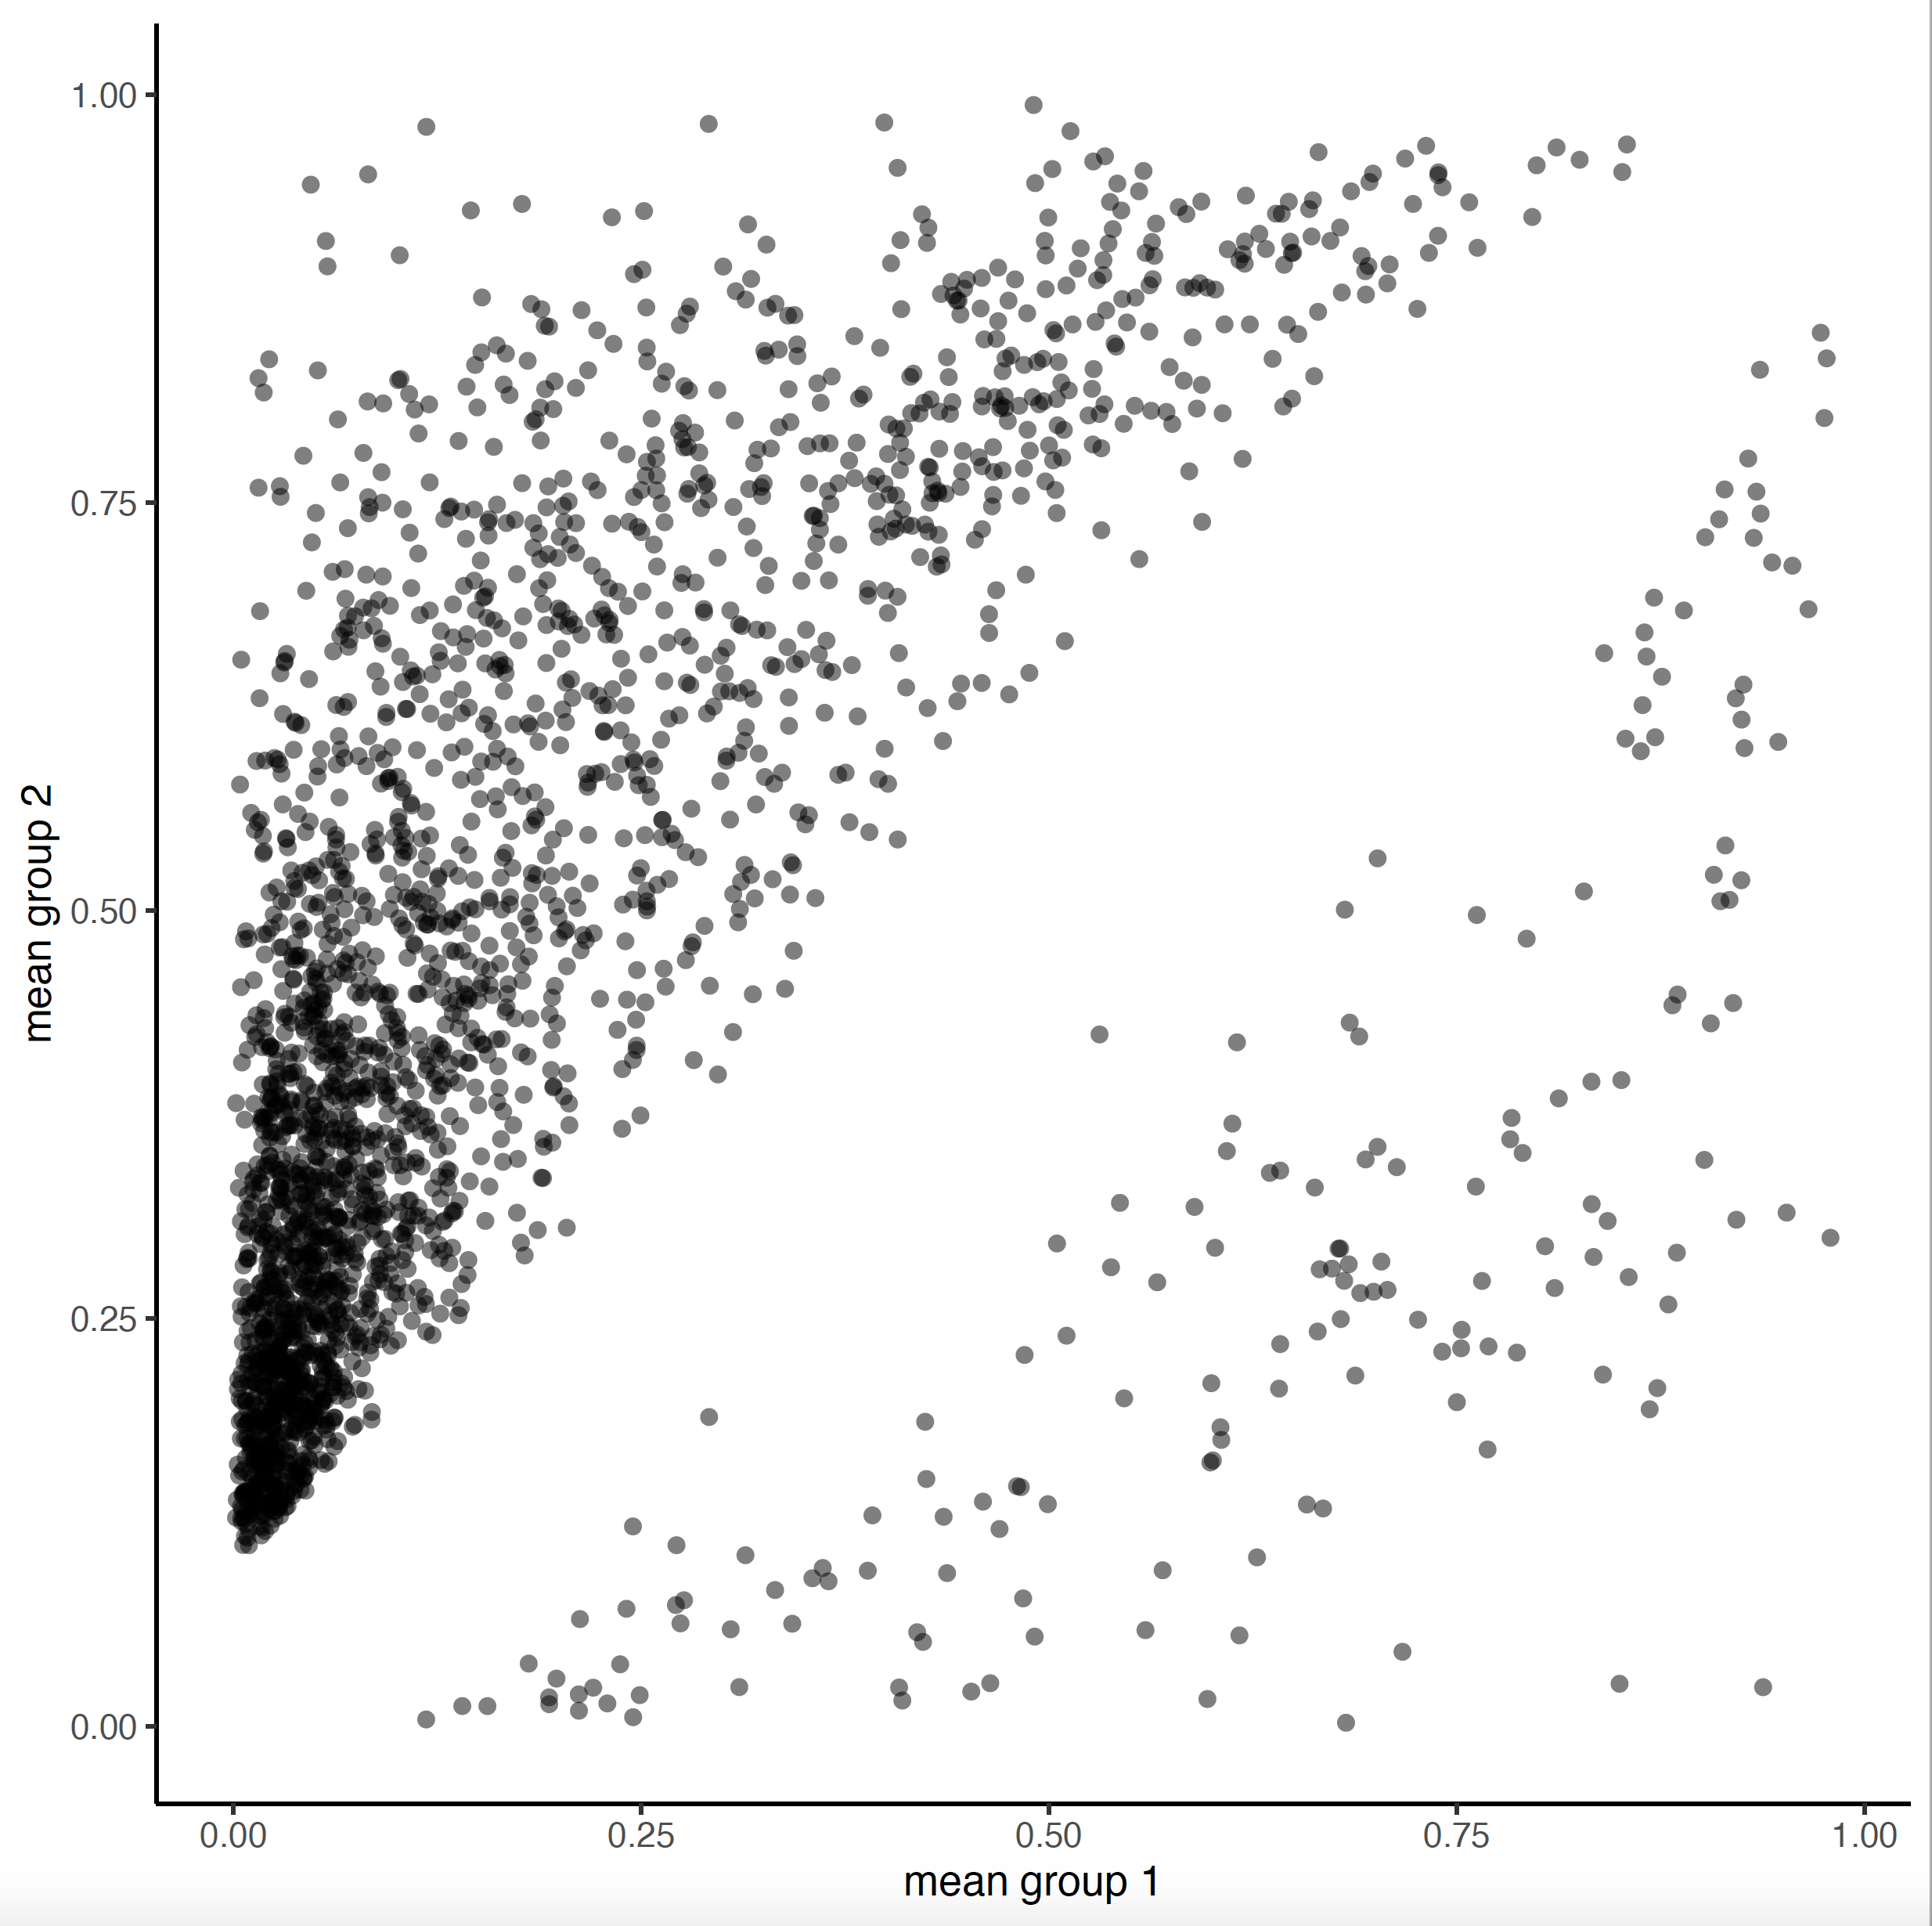
Amongst other results, trace the PDF output file and look for the plots.




References
- Lin, I.-H., D.-T. Chen, Y.-F. Chang, Y.-L. Lee, C.-H. Su et al., 2015 Hierarchical Clustering of Breast Cancer Methylomes Revealed Differentially Methylated and Expressed Breast Cancer Genes (O. El-Maarri, Ed.). PLOS ONE 10: e0118453. 10.1371/journal.pone.0118453
- Joachim Wolff, Devon Ryan, 2020 DNA Methylation data analysis (Galaxy Training Materials). /training-material/topics/epigenetics/tutorials/methylation-seq/tutorial.html Online; accessed Tue Jul 28 2020
- Batut et al., 2018 Community-Driven Data Analysis Training for Biology Cell Systems 10.1016/j.cels.2018.05.012