A primer on FASTQC and Cutadapt | Quality Control of Genomic Data in Galaxy
Before anything though, we must execute the Galaxy instance and create a session; then load the file to examine. Please refer to Introduction To Galaxy for details.
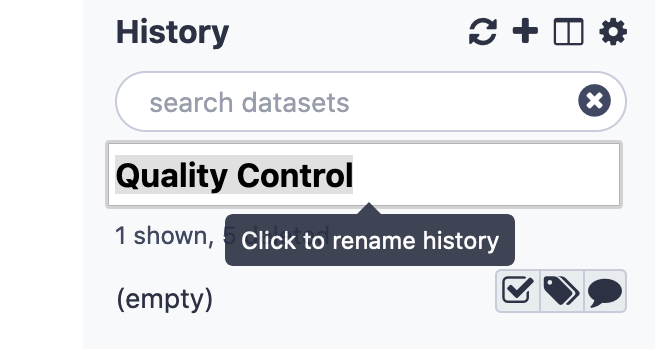
We shall commence by assigning an appropriate name for our analysis session. This can be achieved via renaming the "unnamed history".
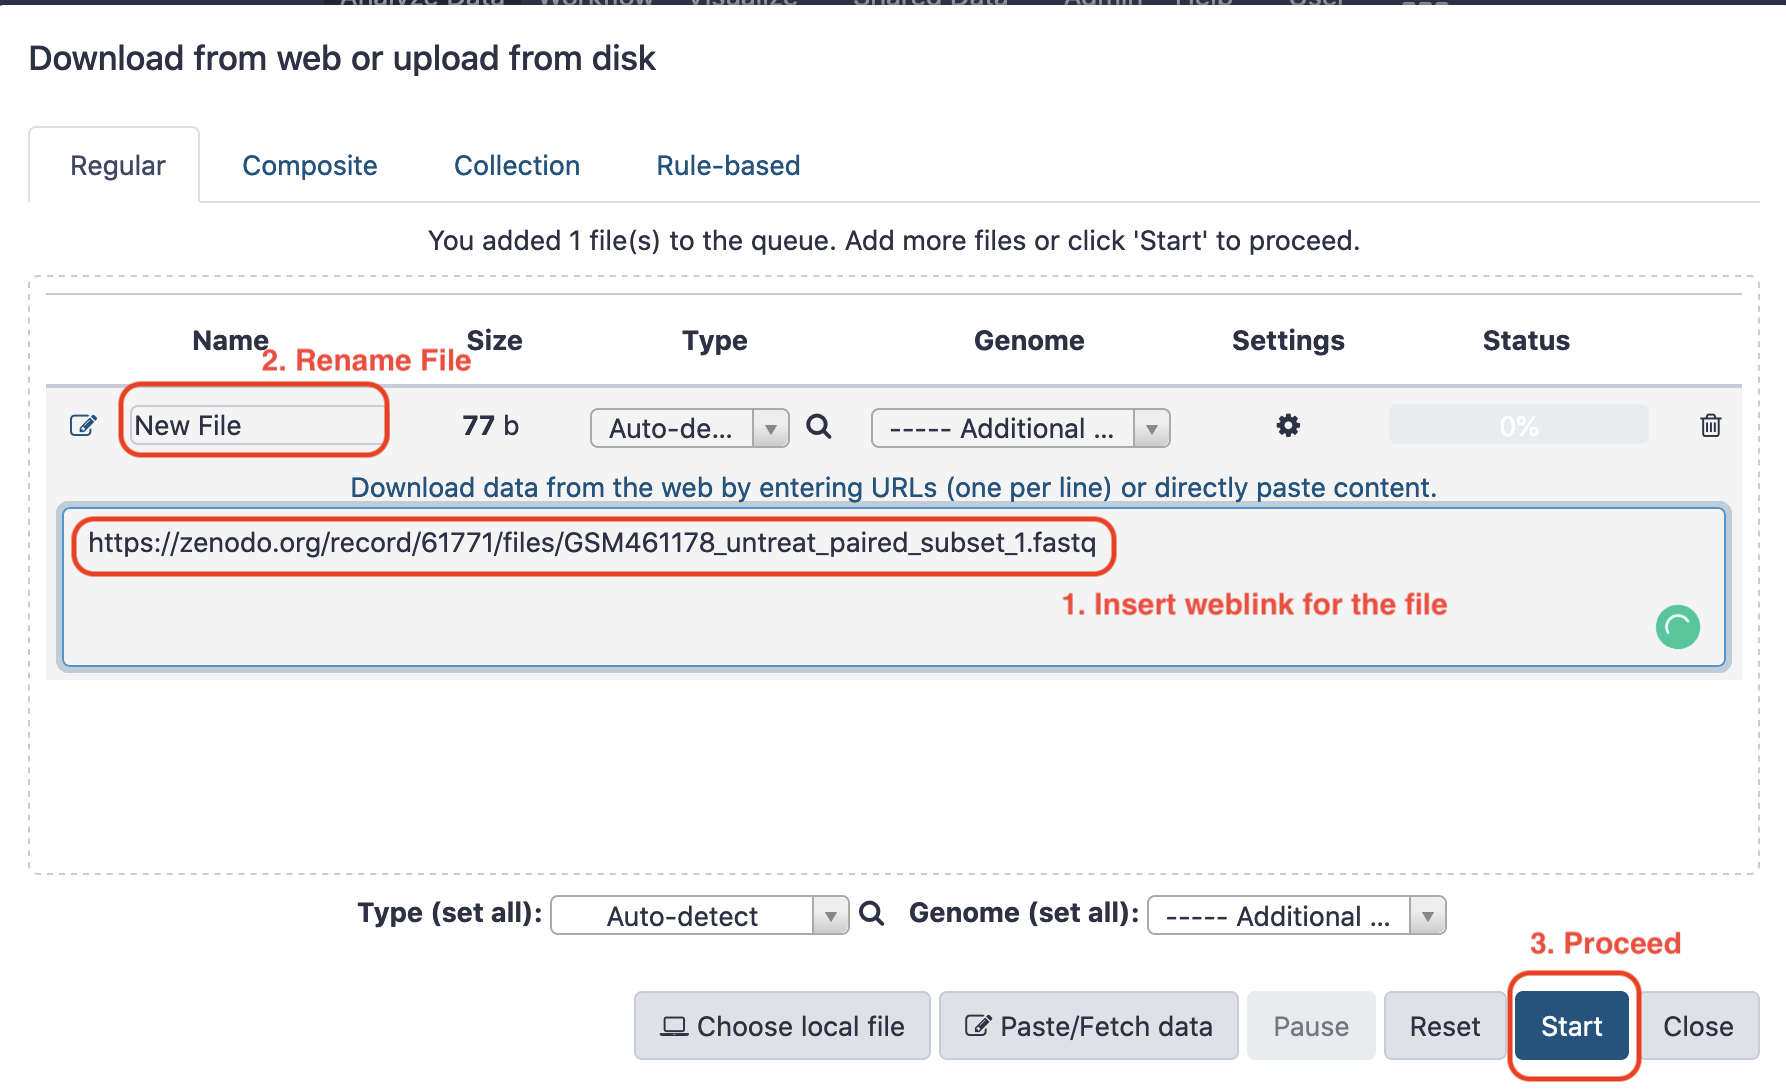
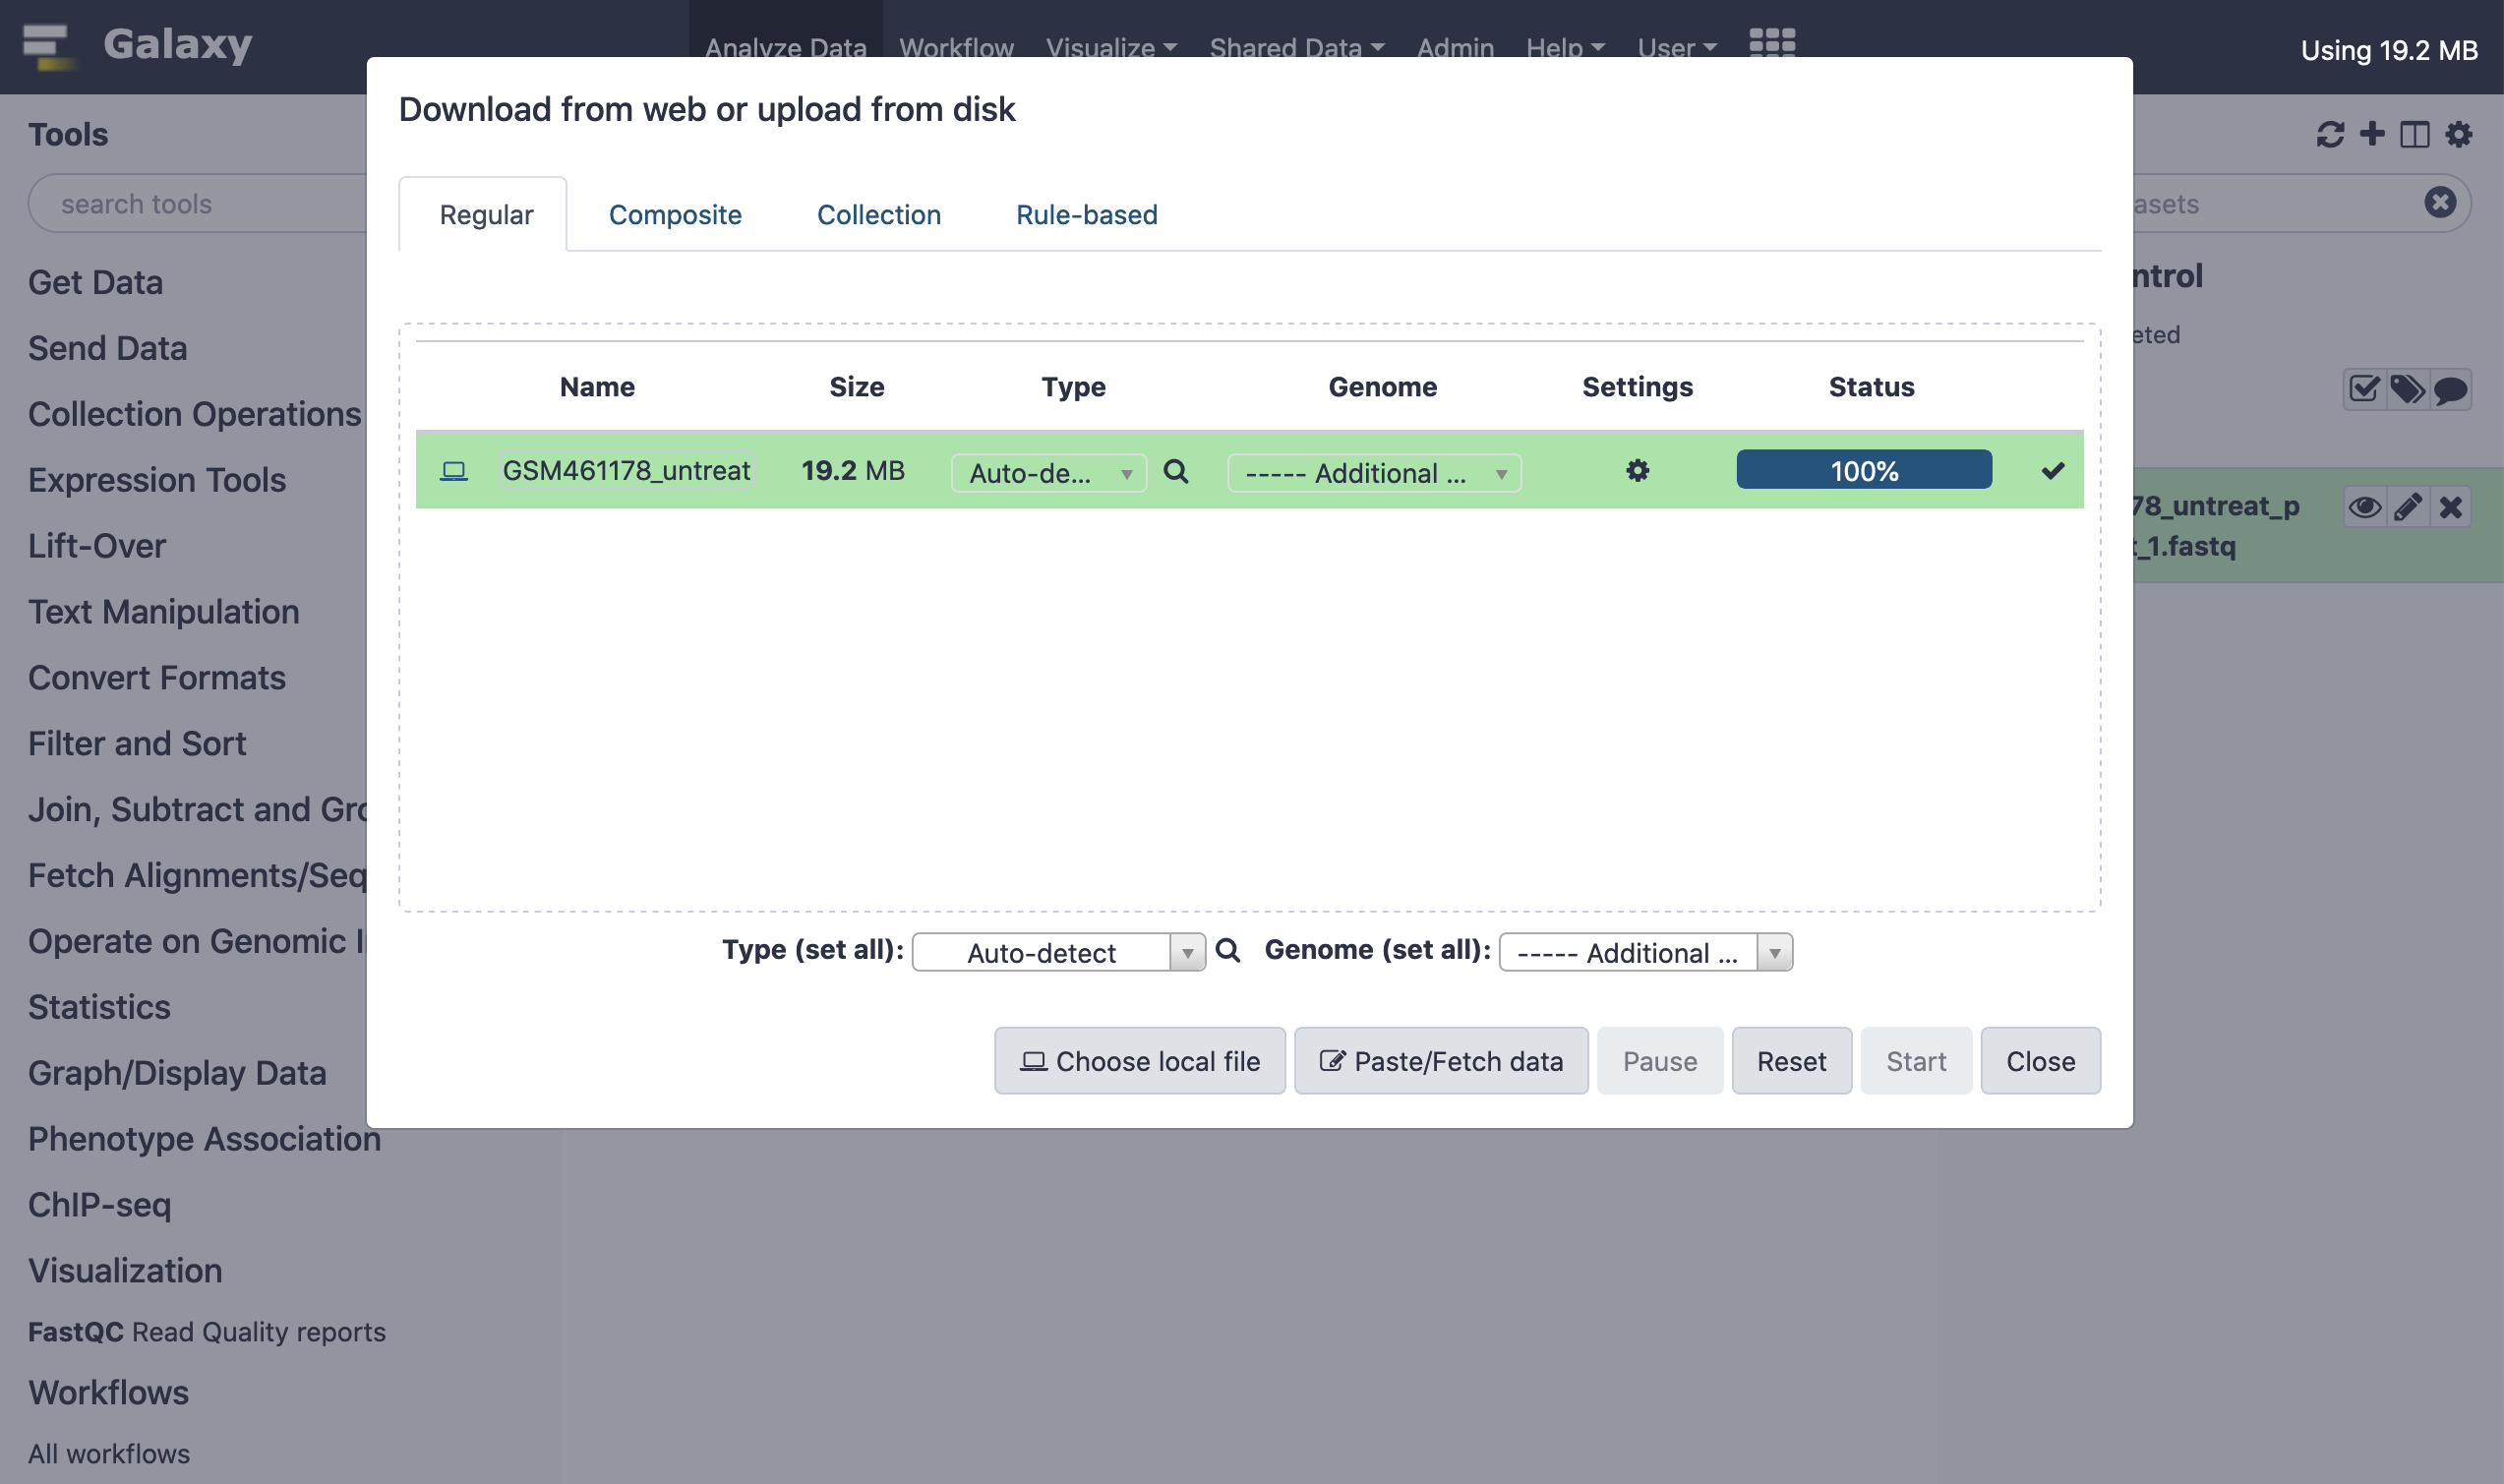
Thereafter, we shall load the data into this newly created session. There could be disparate approaches to loading the data. It could either be loaded from the local host system by browsing the file from the disk, or alternatively it could be sourced online.
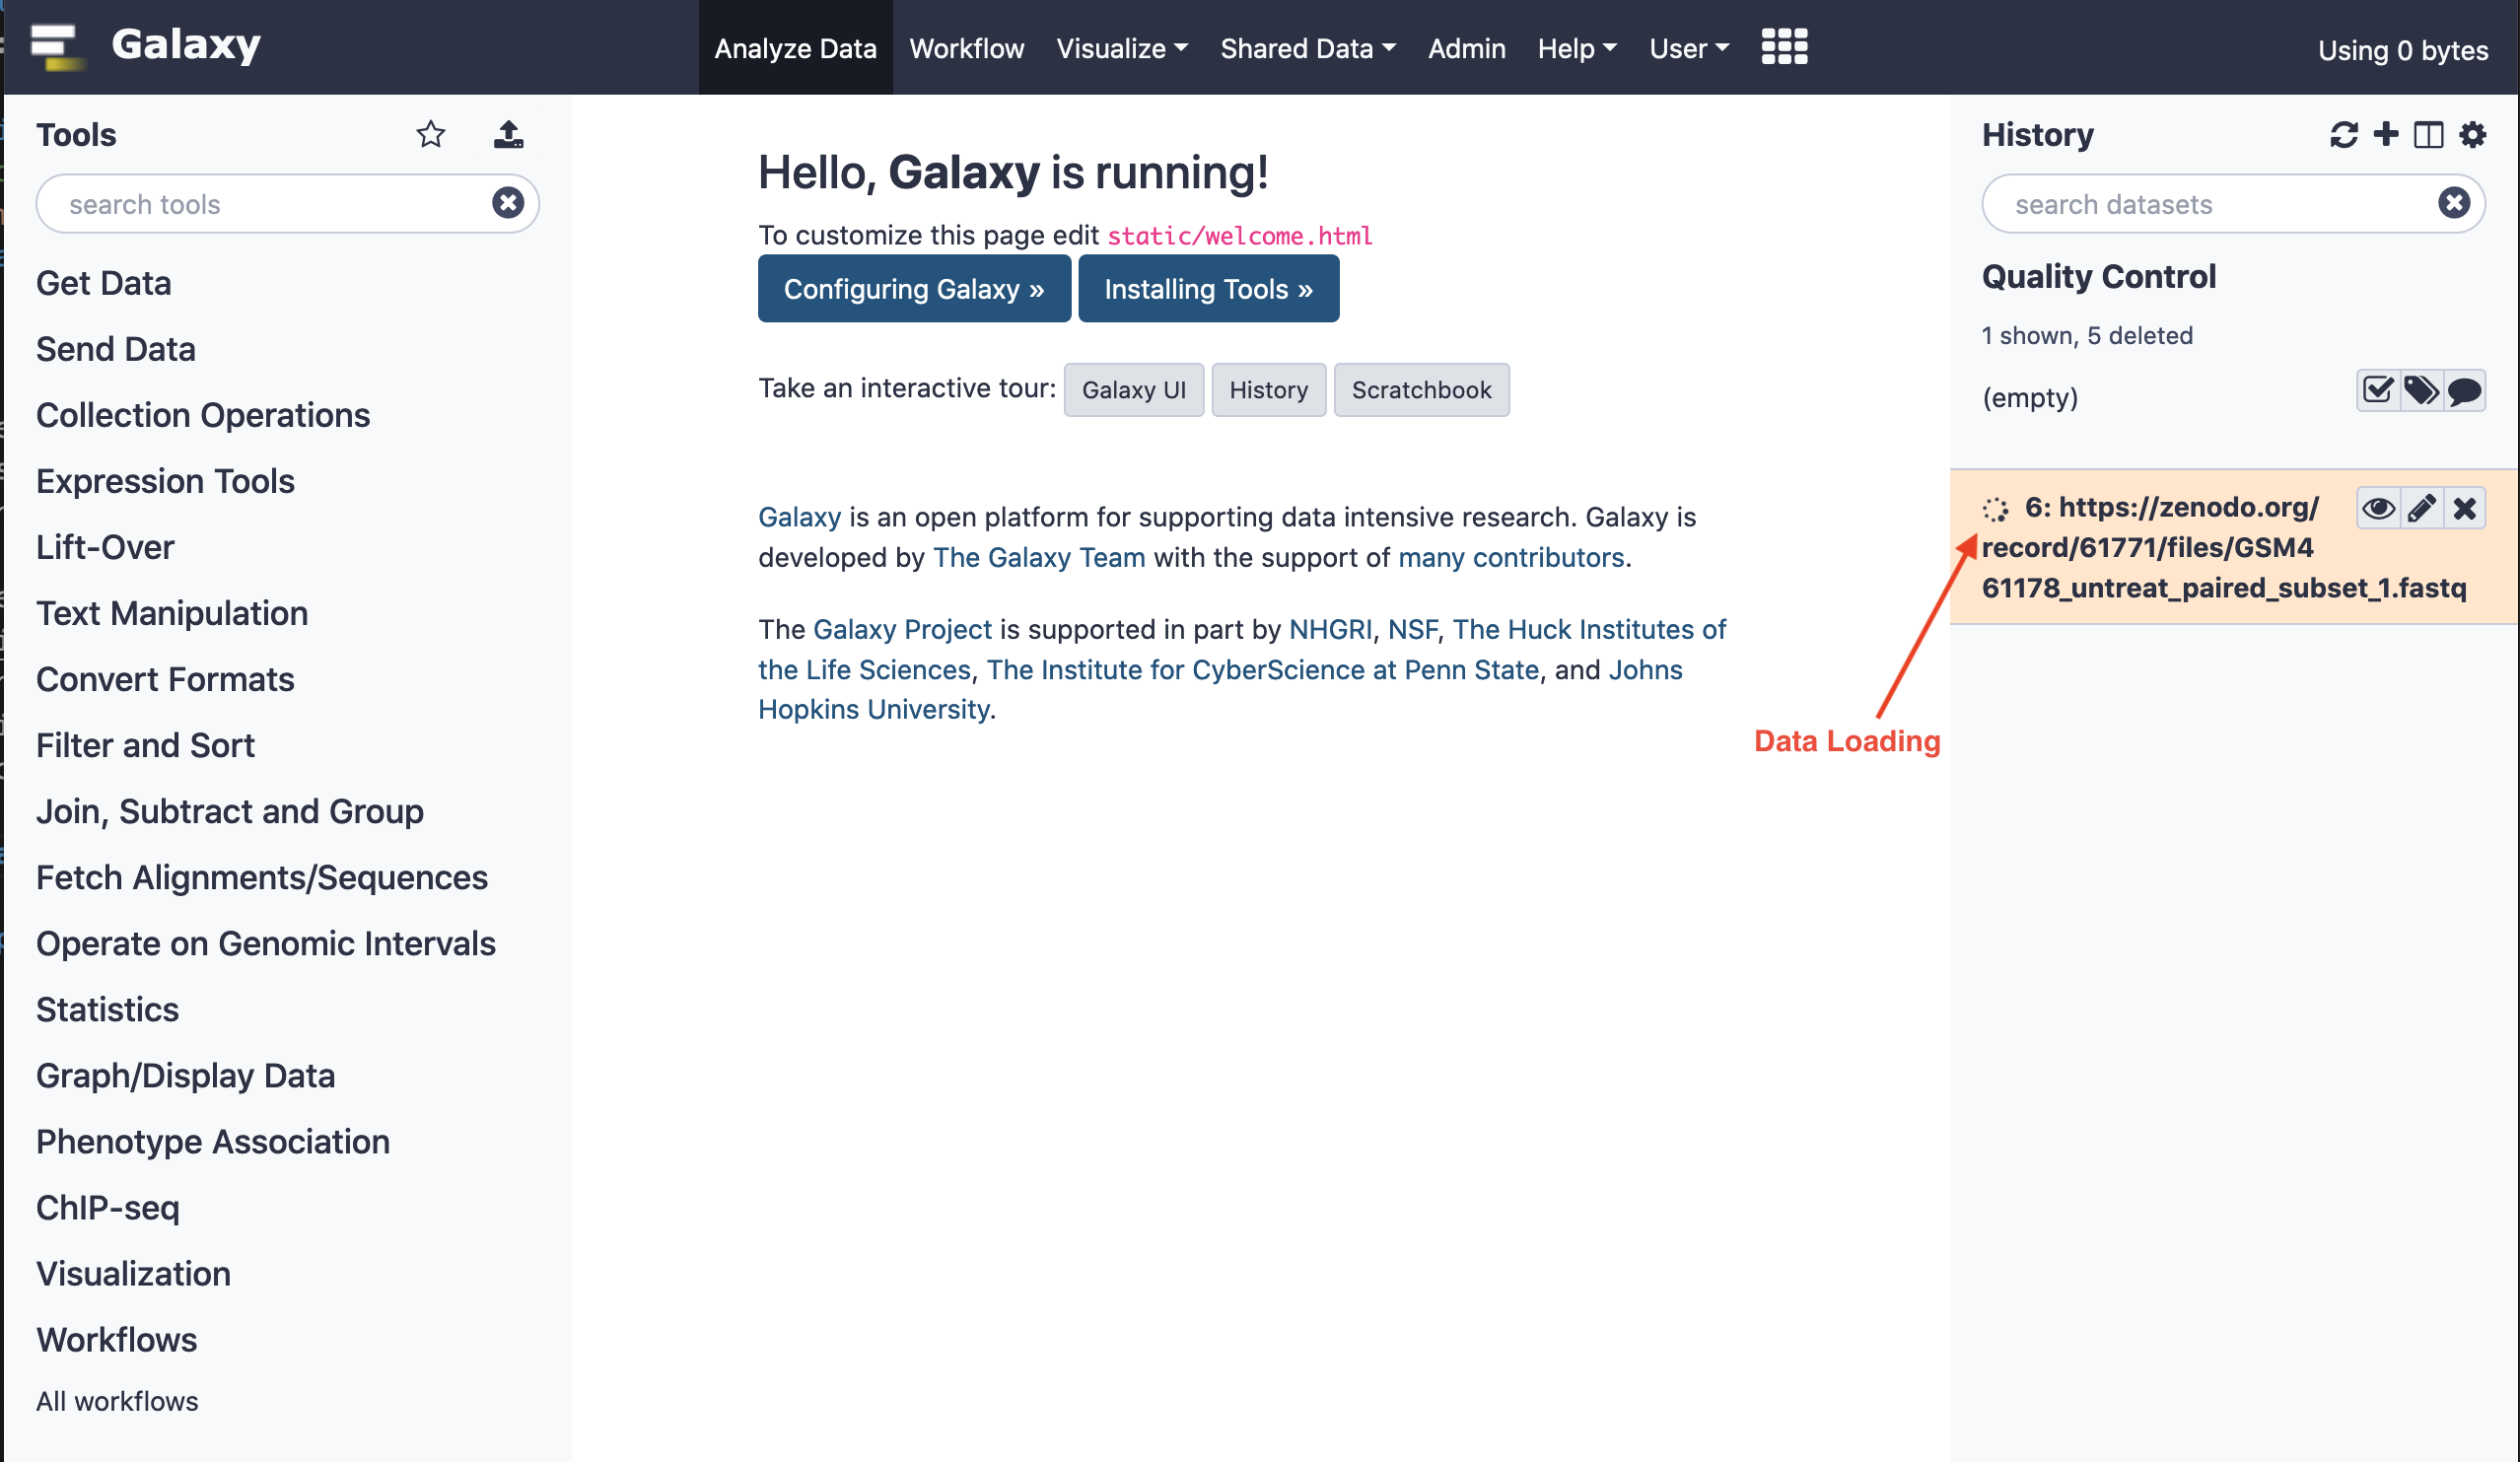
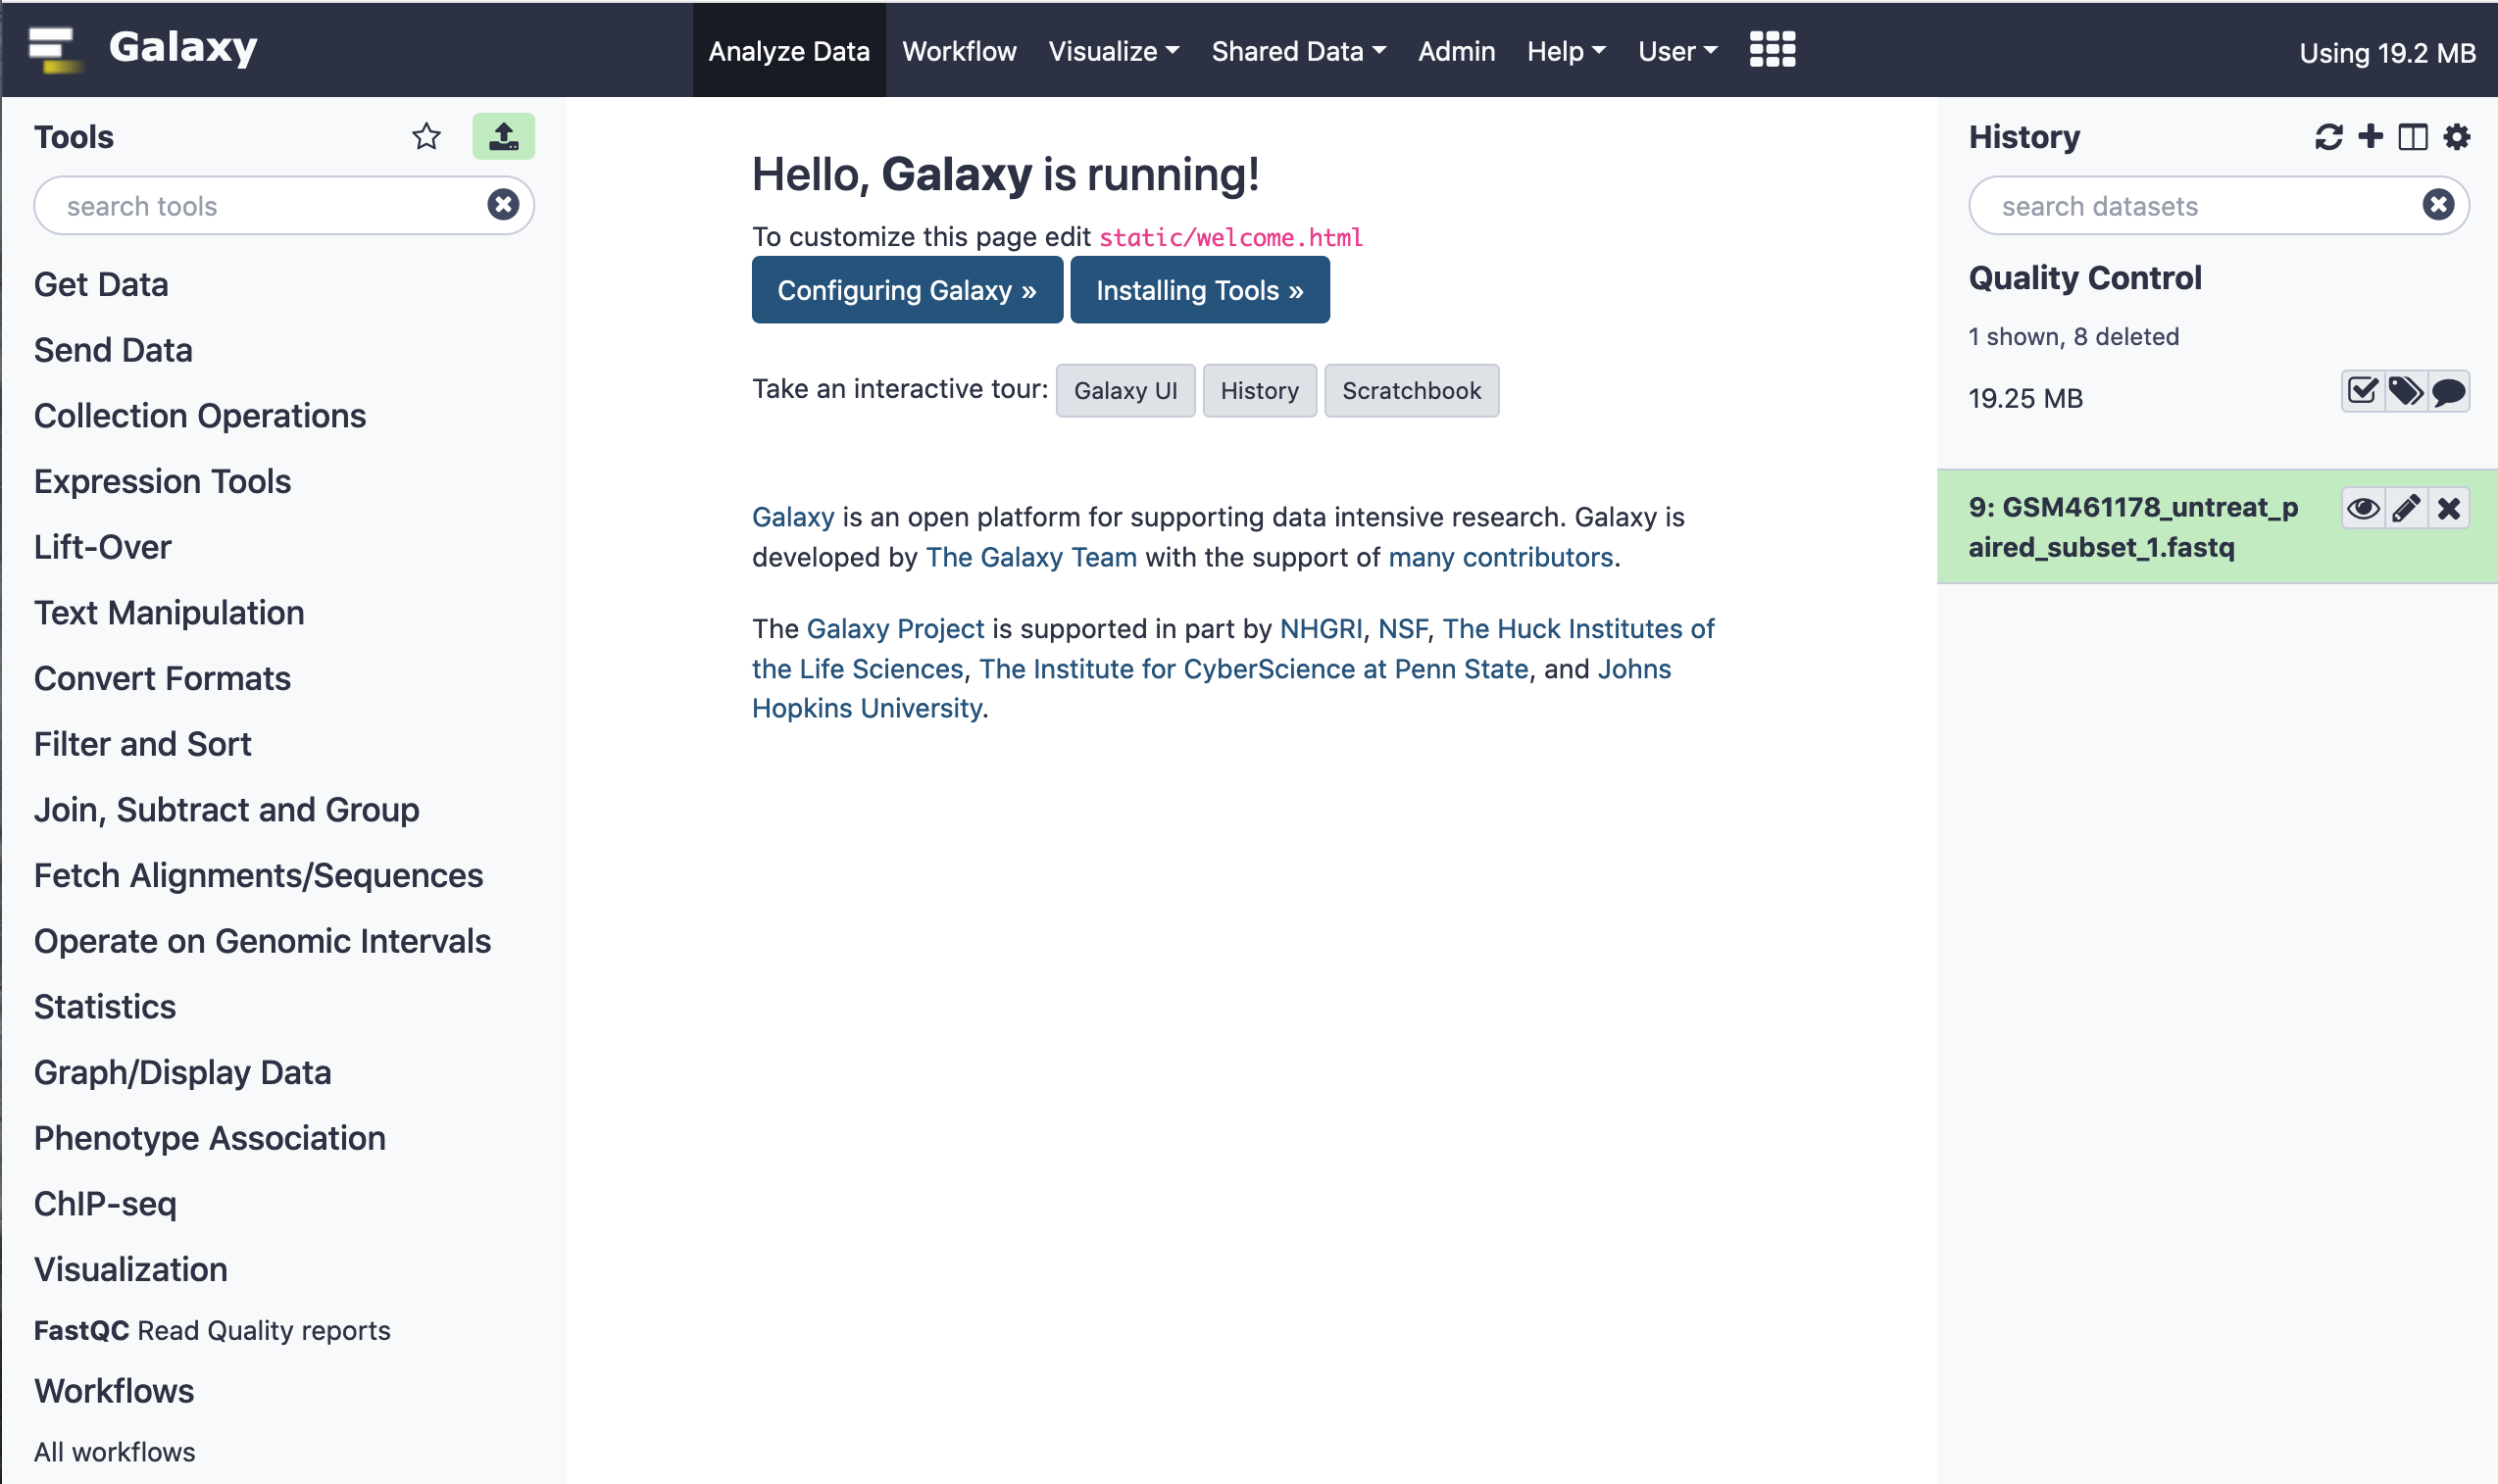
When the data has been successfully loaded into the session's library (history), a green ambience could be realized in the file listing.
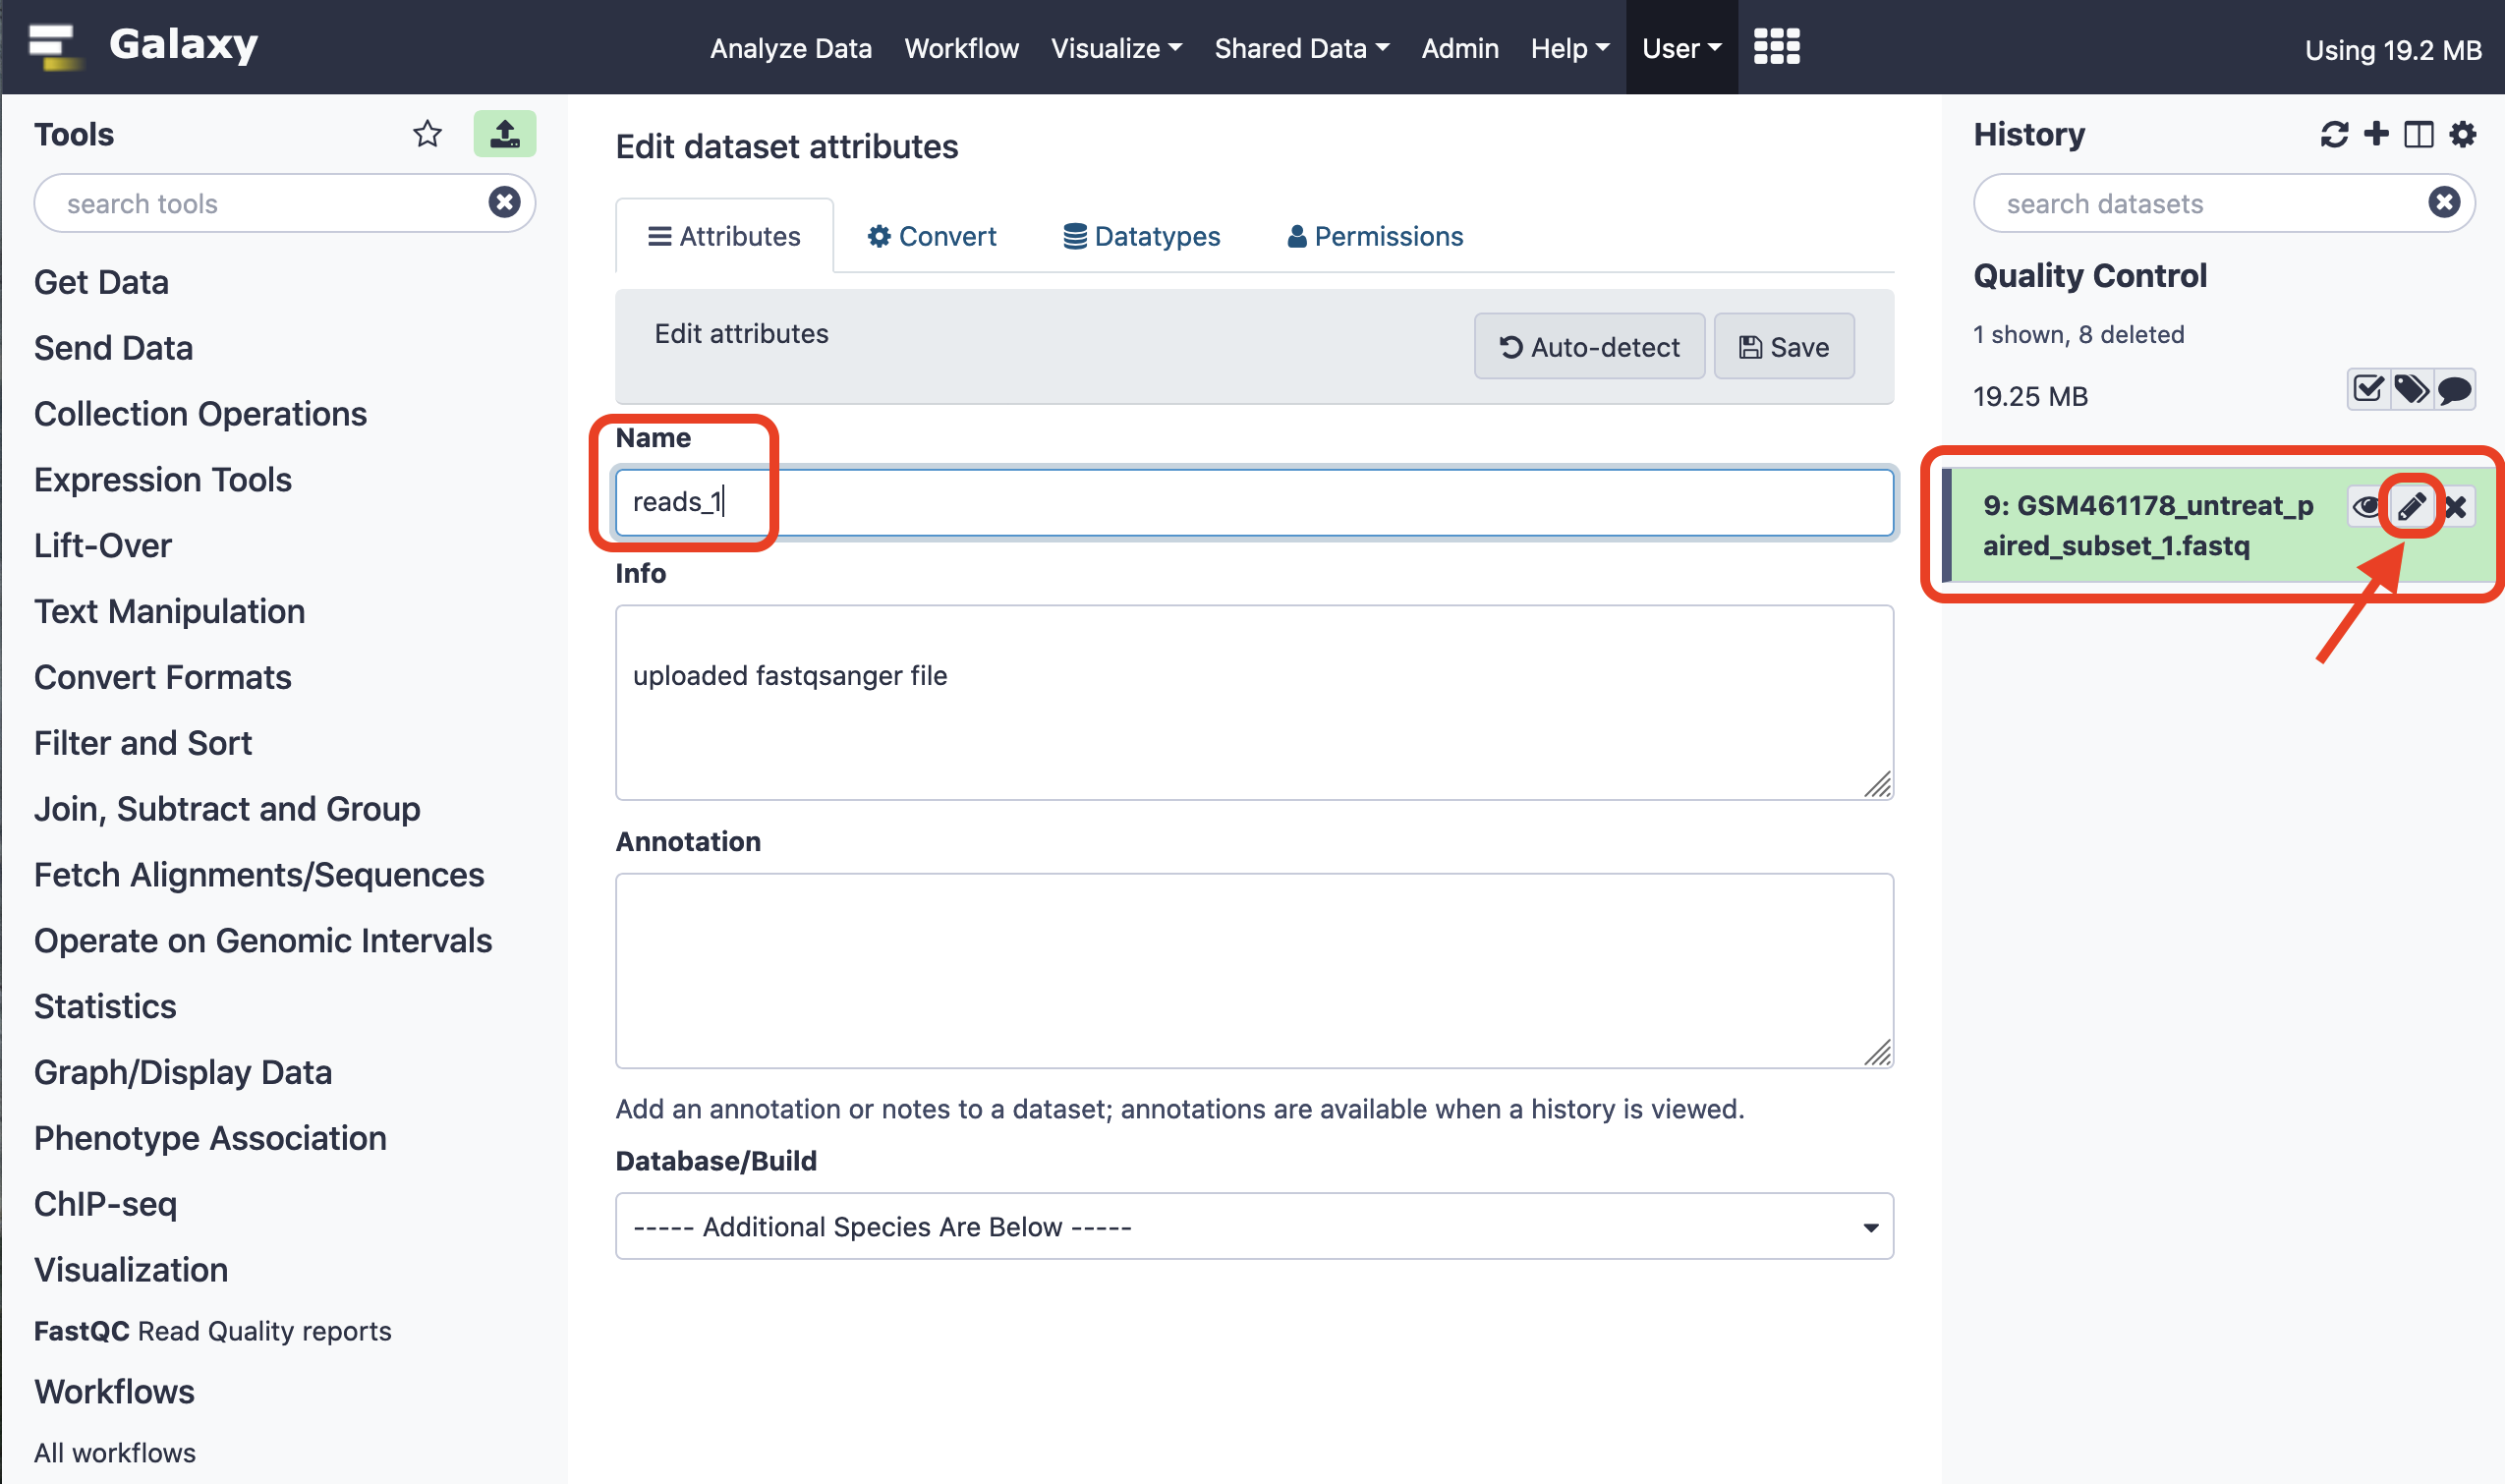
Next, we rename the file for convenience to facilitate downstream analysis.
P.S. Due to network issues, the data was manually downloaded from the source and uploaded to Galaxy instance.
We can have a cursory glance at the data.
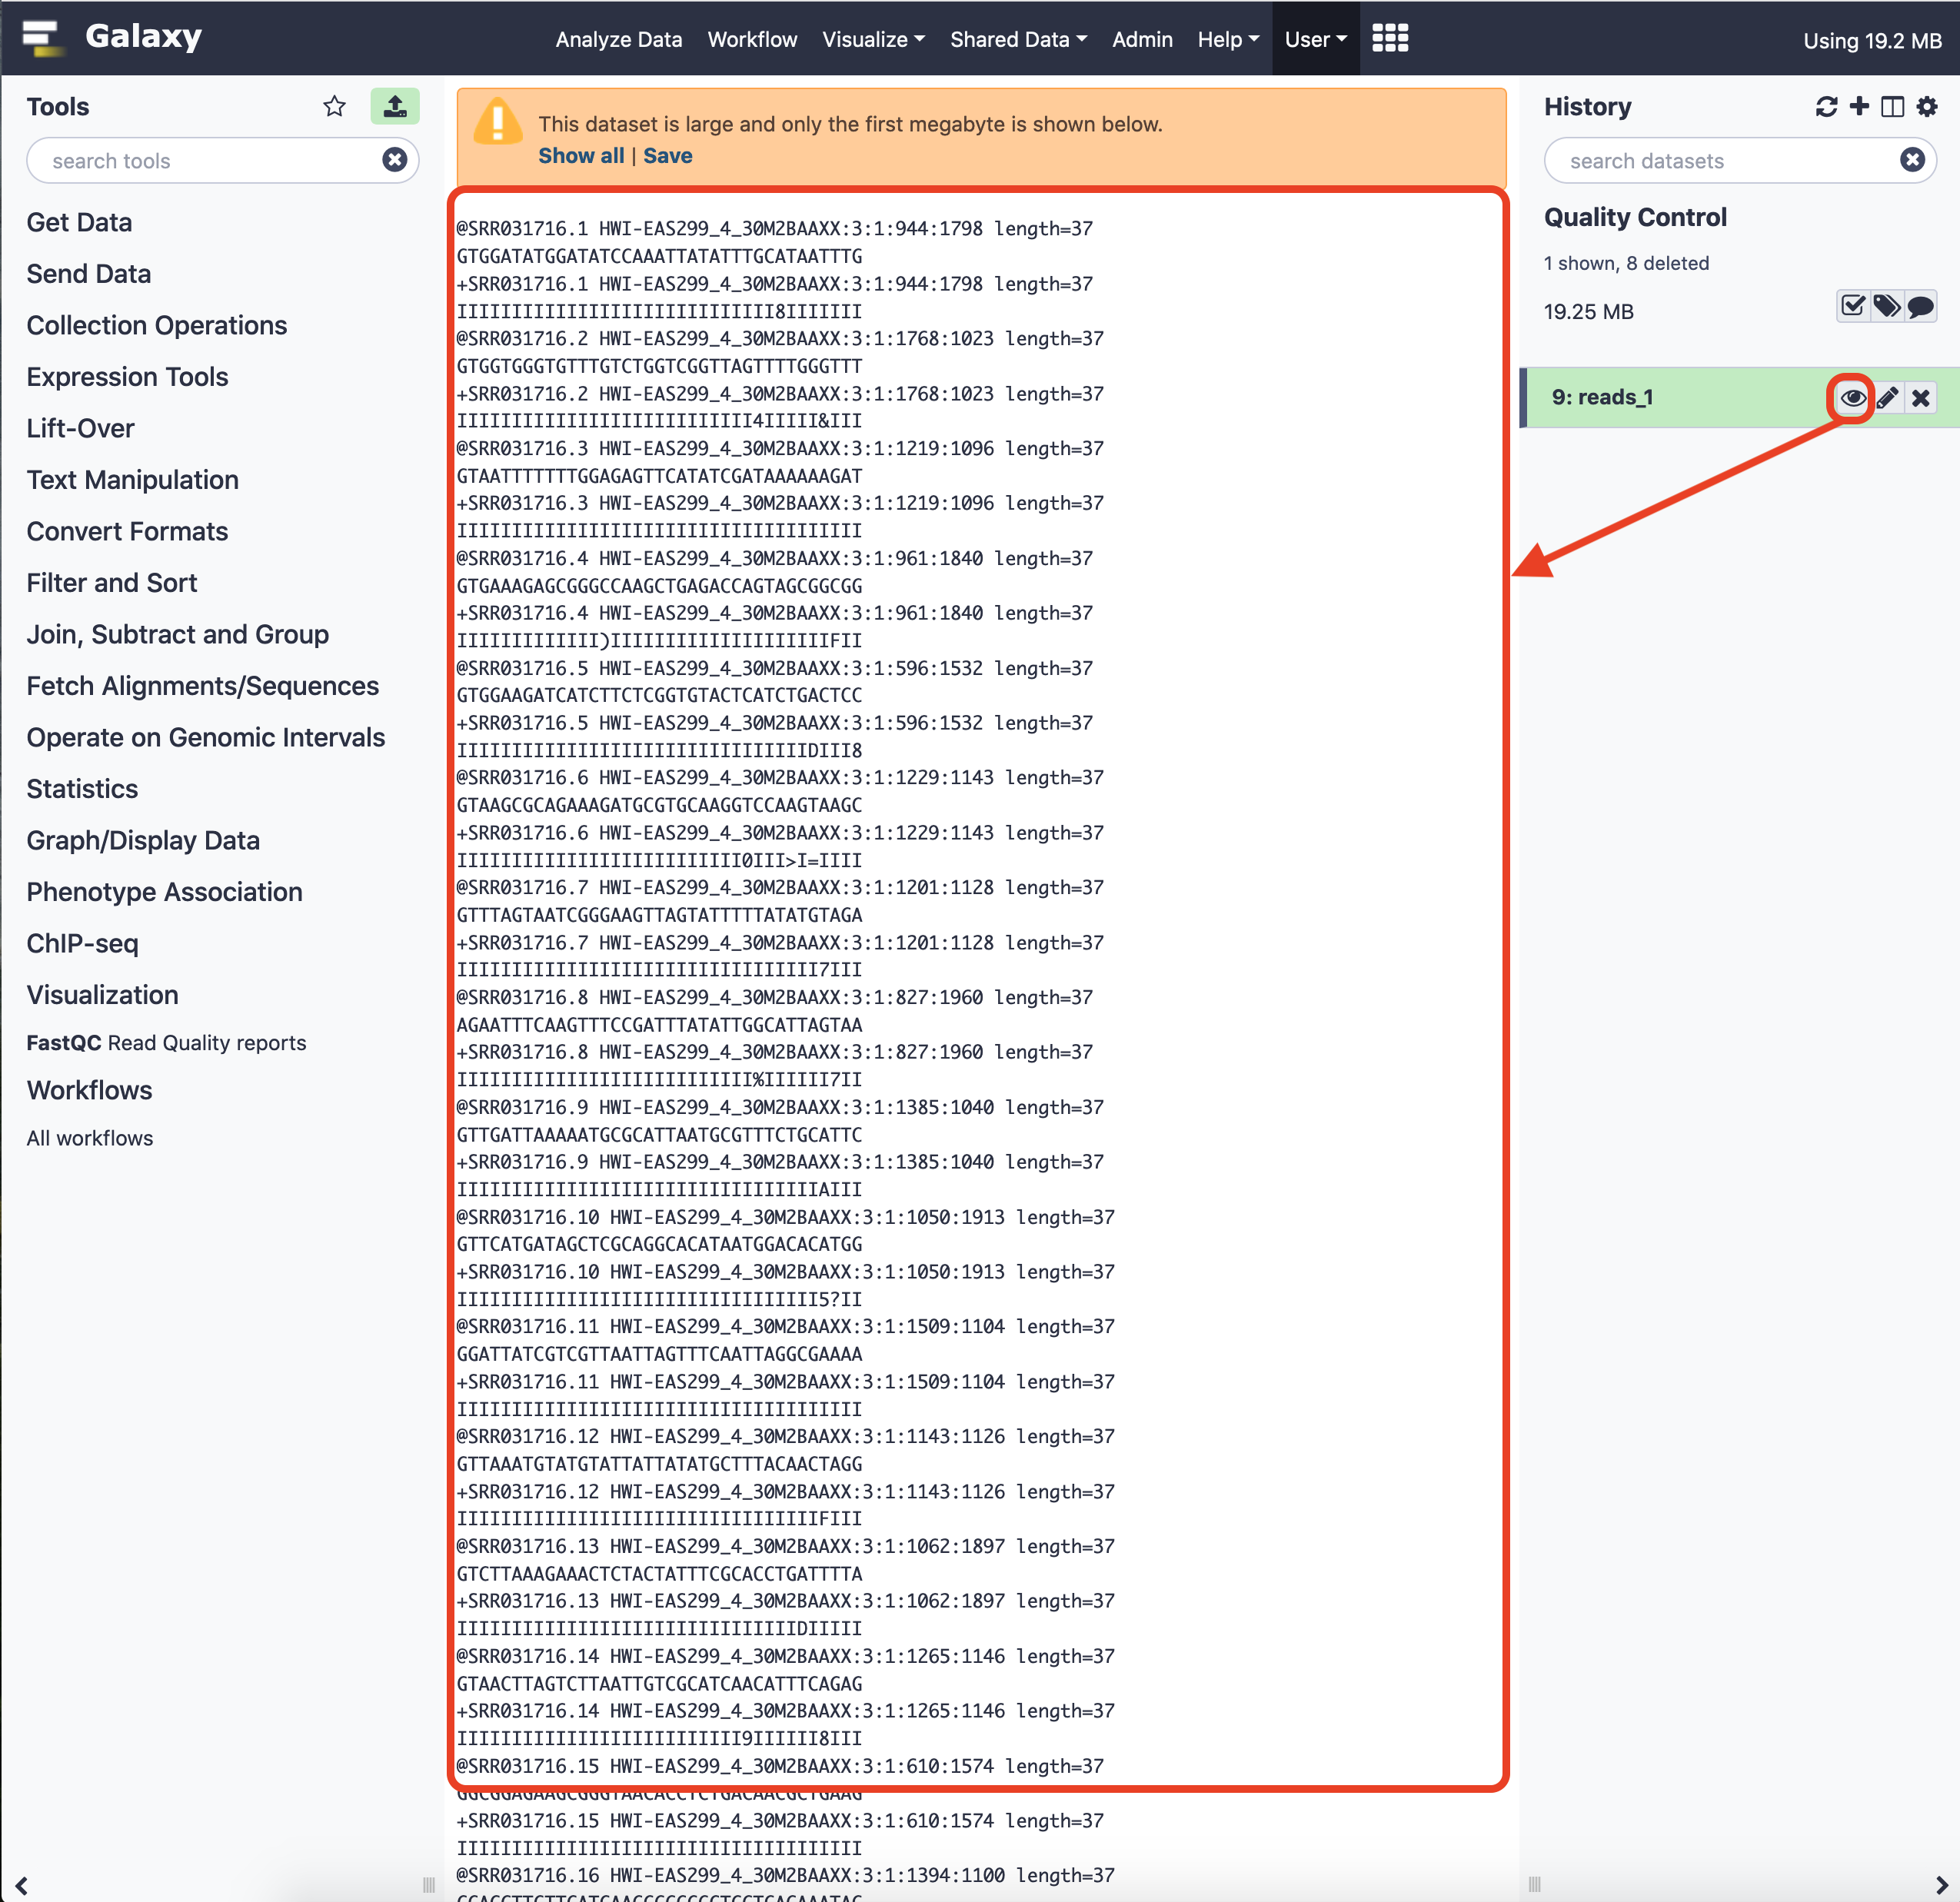
For more details on the format, please visit the link here .
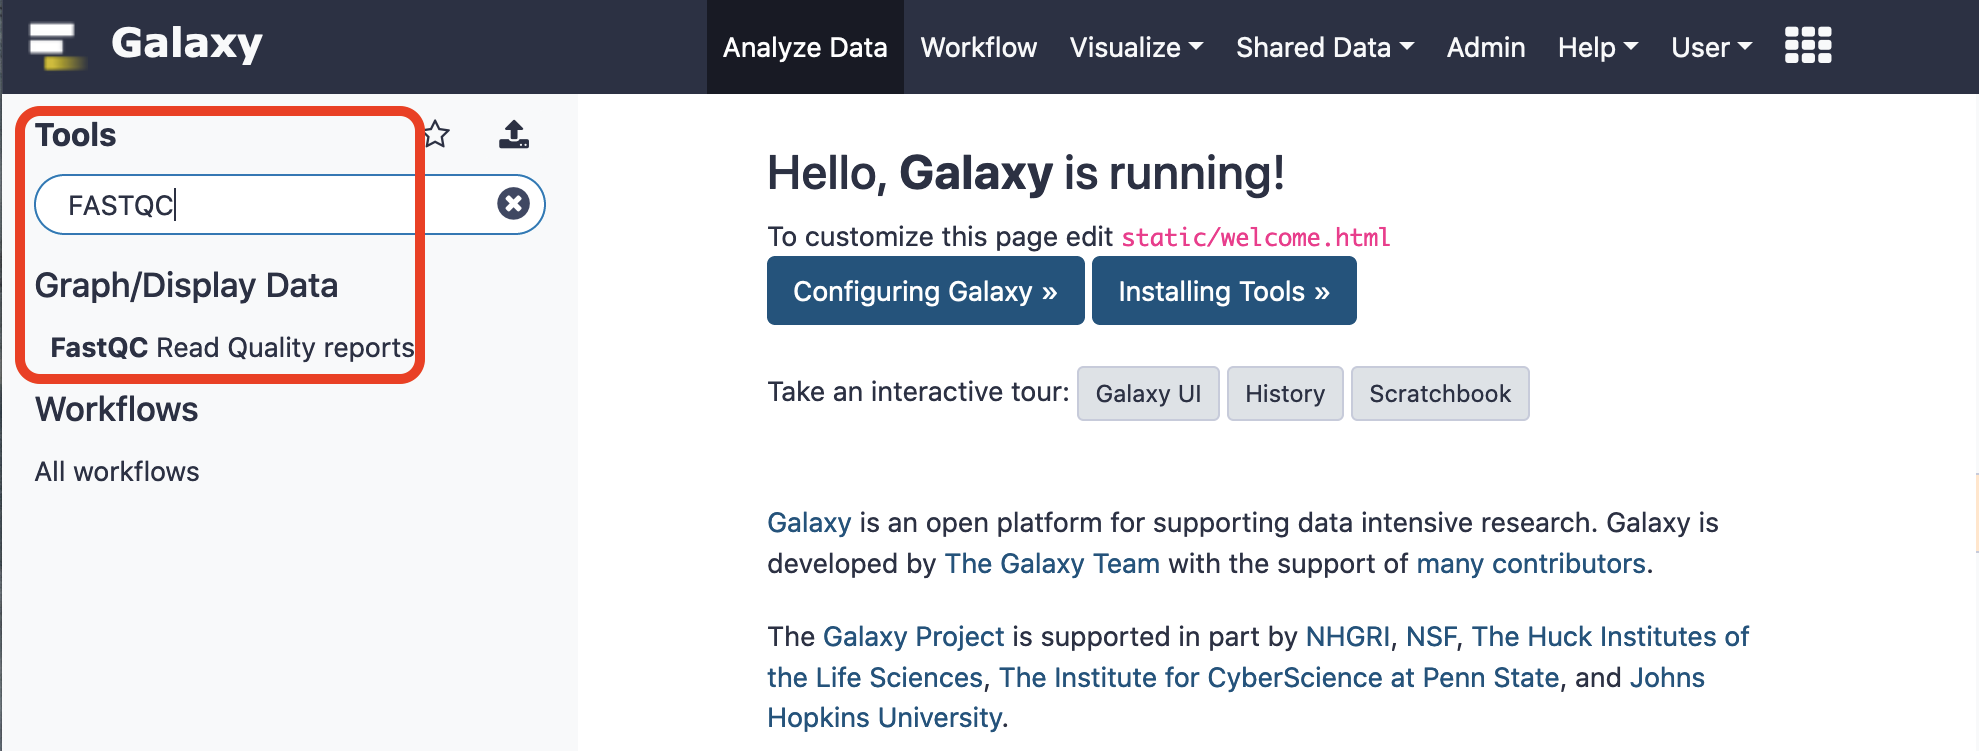
After looking at the data file, the next step is to install an appropriate tool. For our case, we shall implement FASTQC for summarizing the read quality of the fastq file, and analyze other statistics. For a quick look on installing a tool in the local distribution of galaxy, please follow the link here .
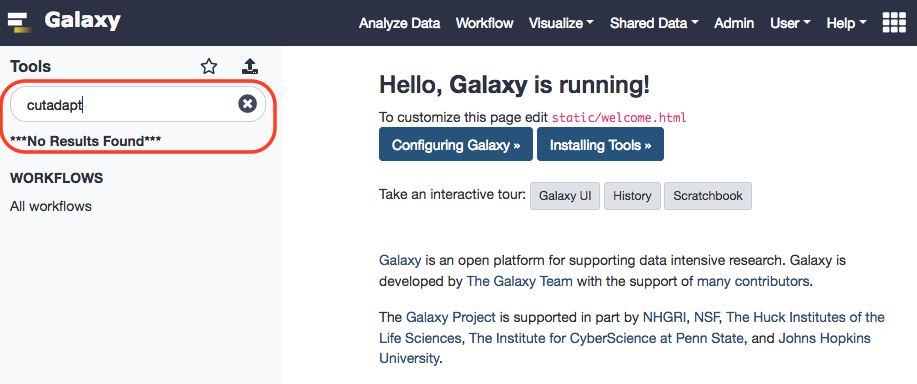
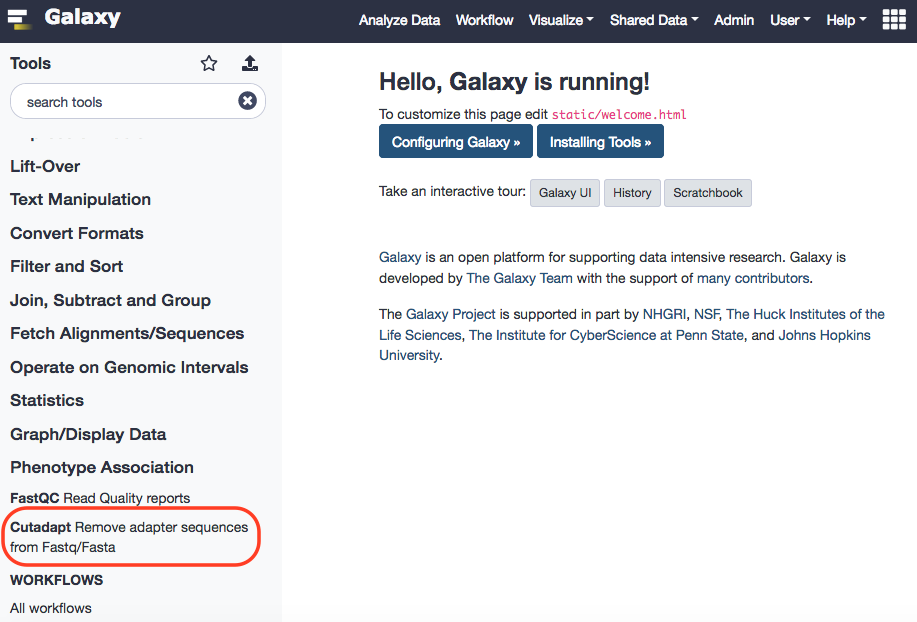
When the tool is successfully installed, it can be traced with a local search.
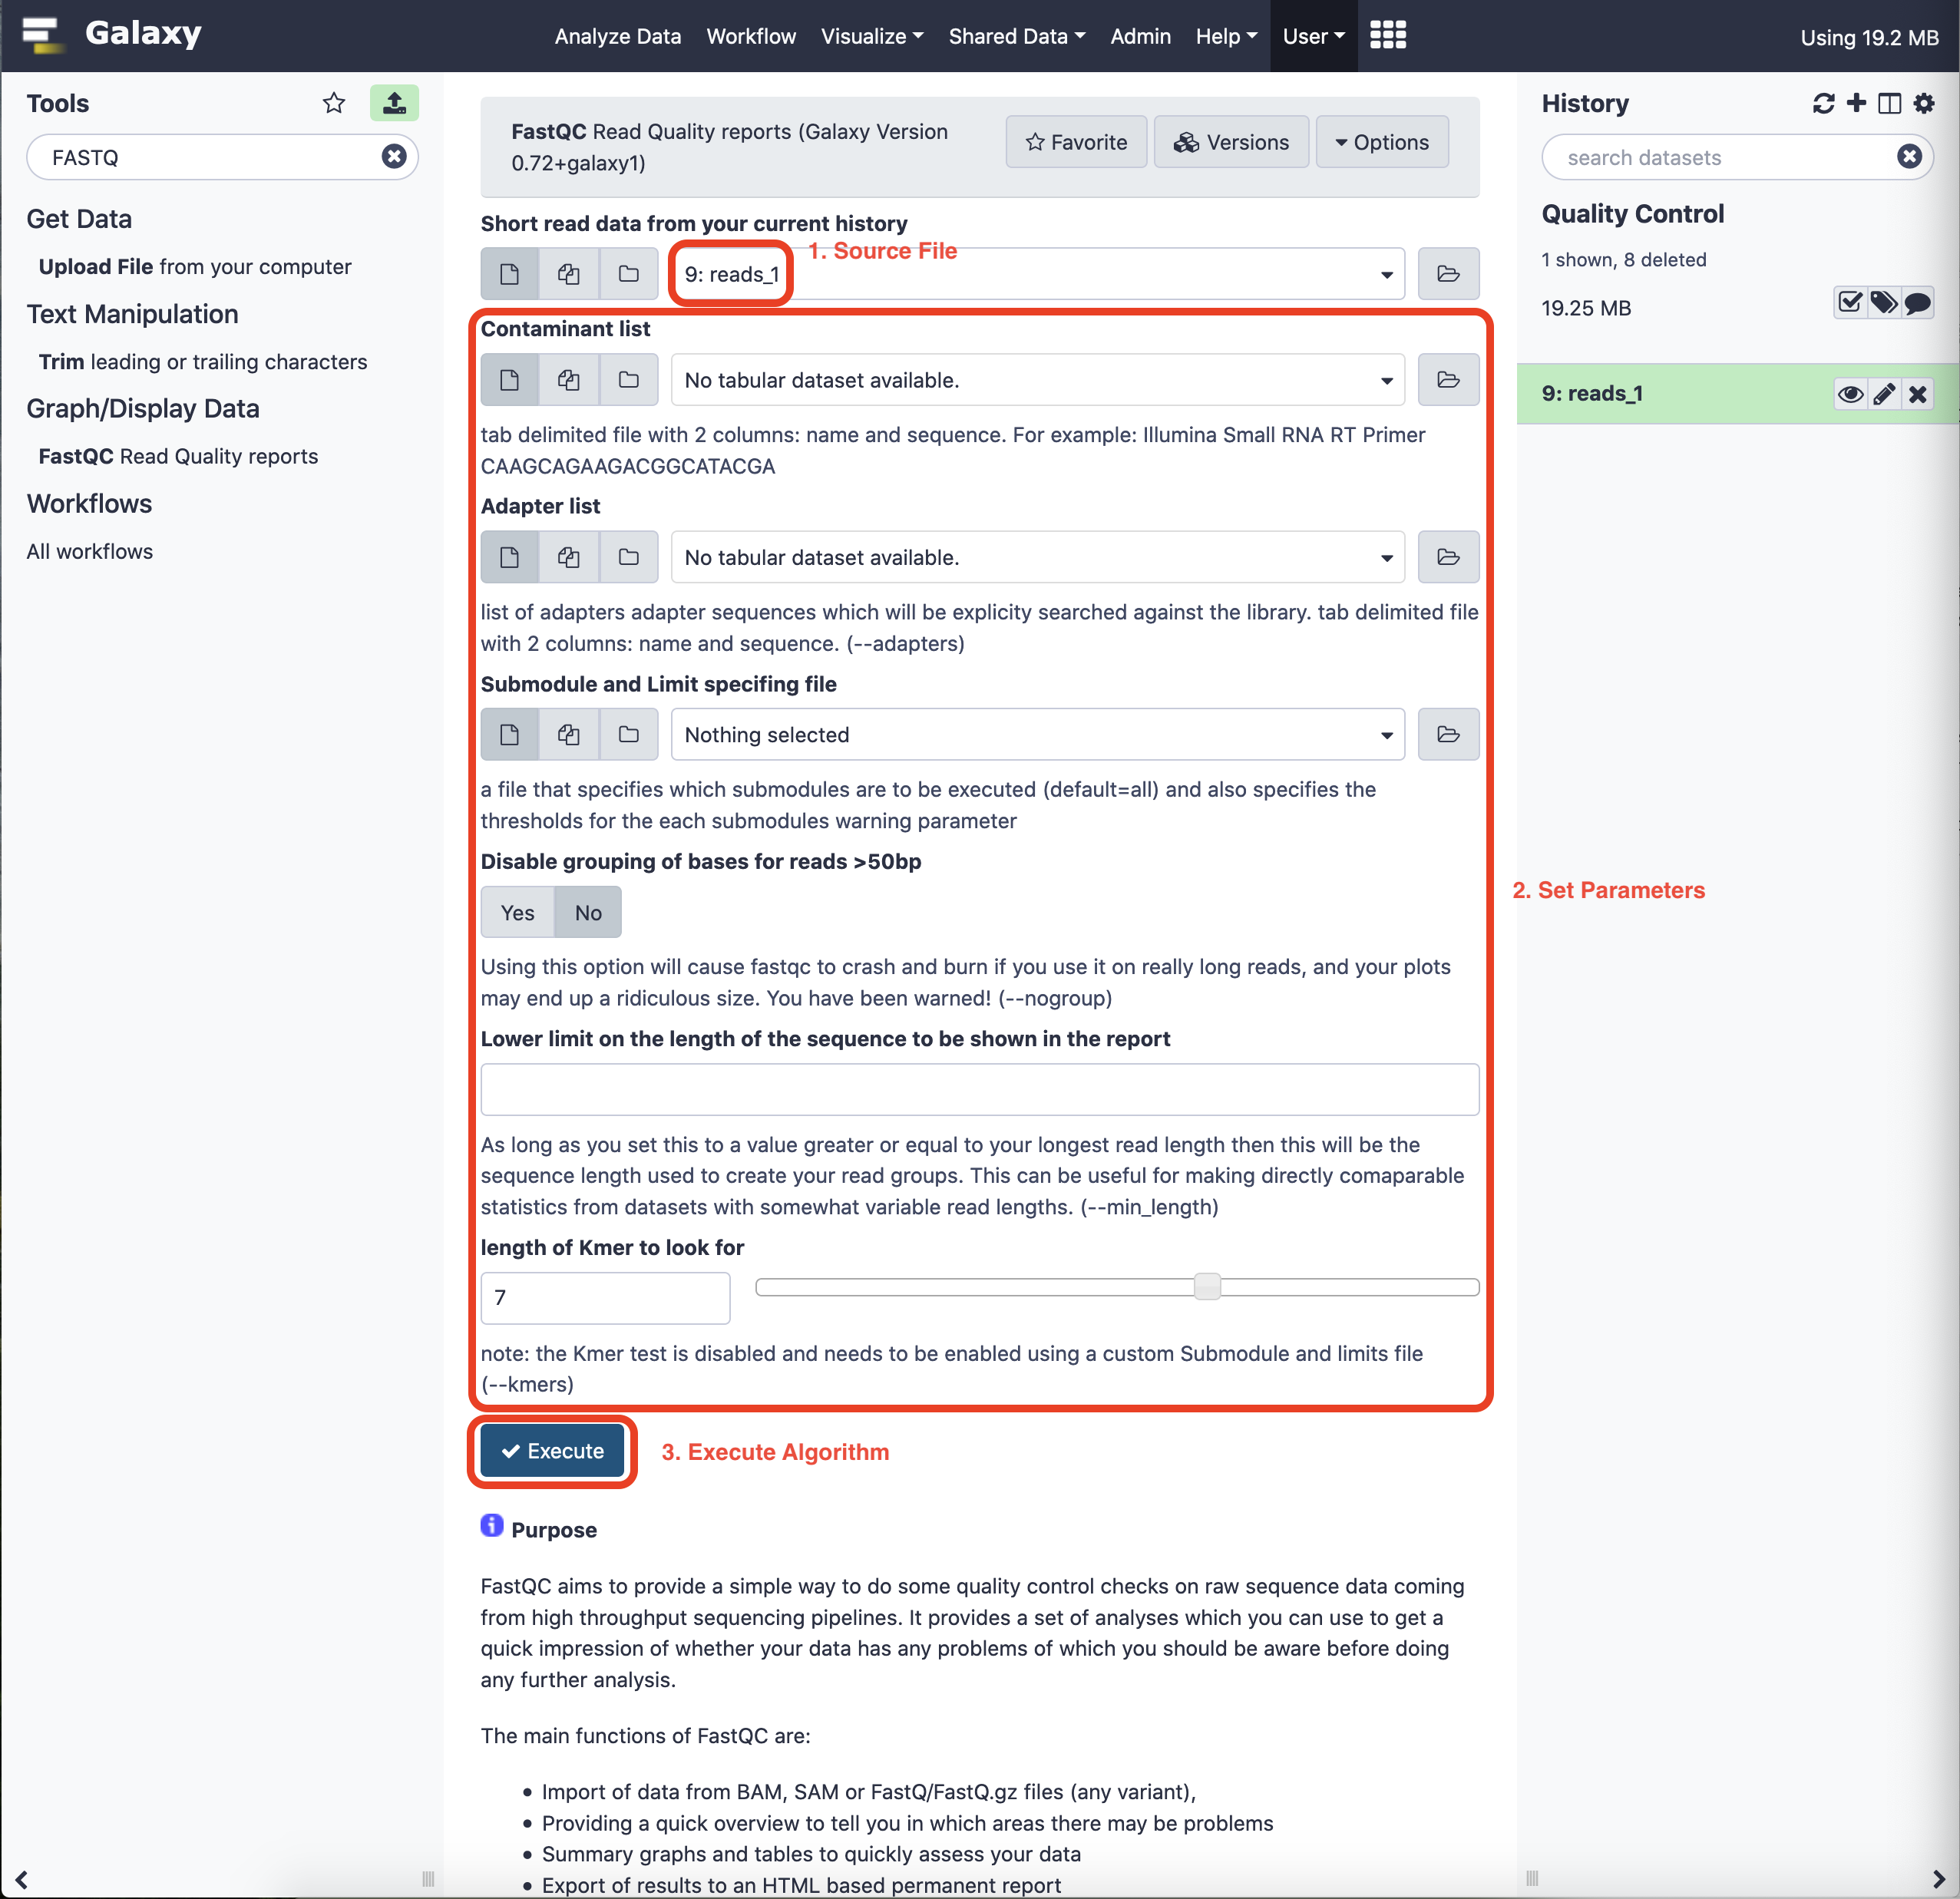
On selecting the tool, the interface opens in the main panel of Galaxy and the user is presented with a choice to select data for application. Before execution, we can choose the associated parameters just as we would specify in the command line. For now, we shall stick to the defaults.
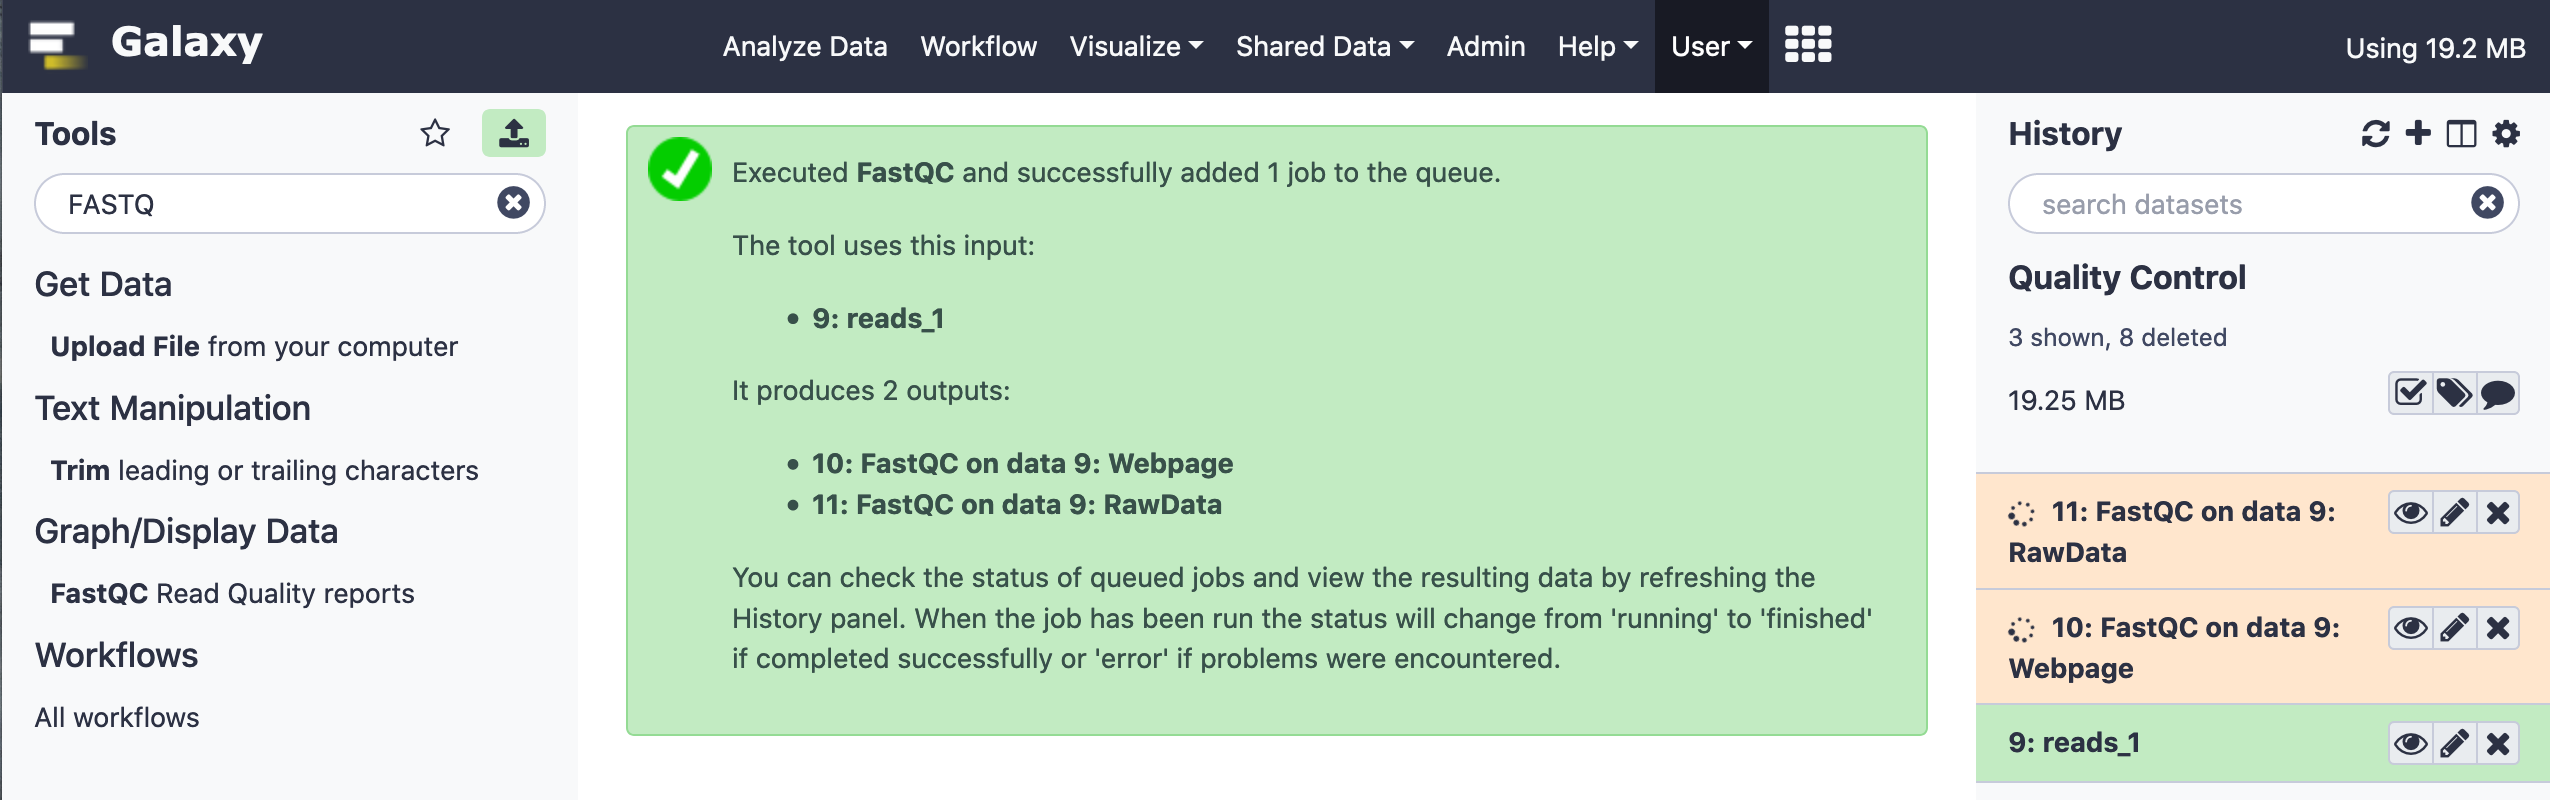
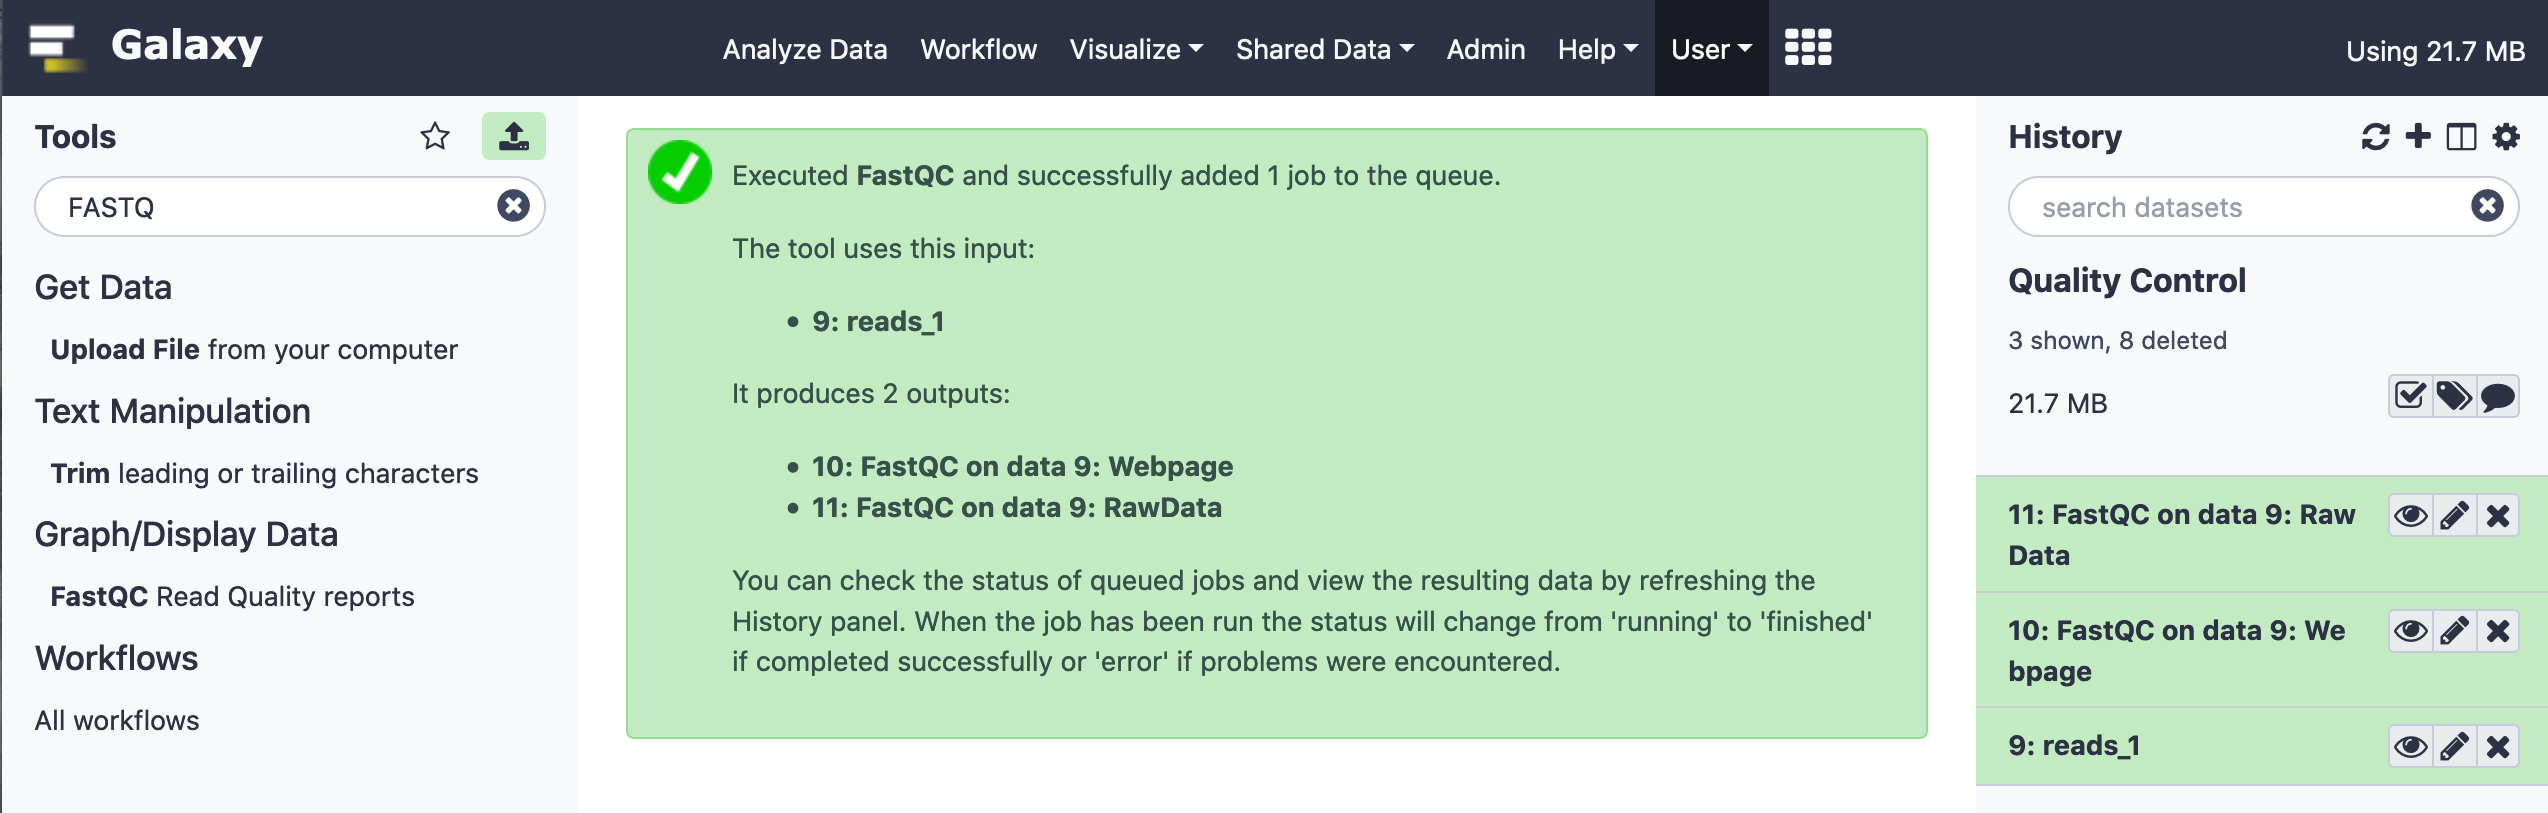
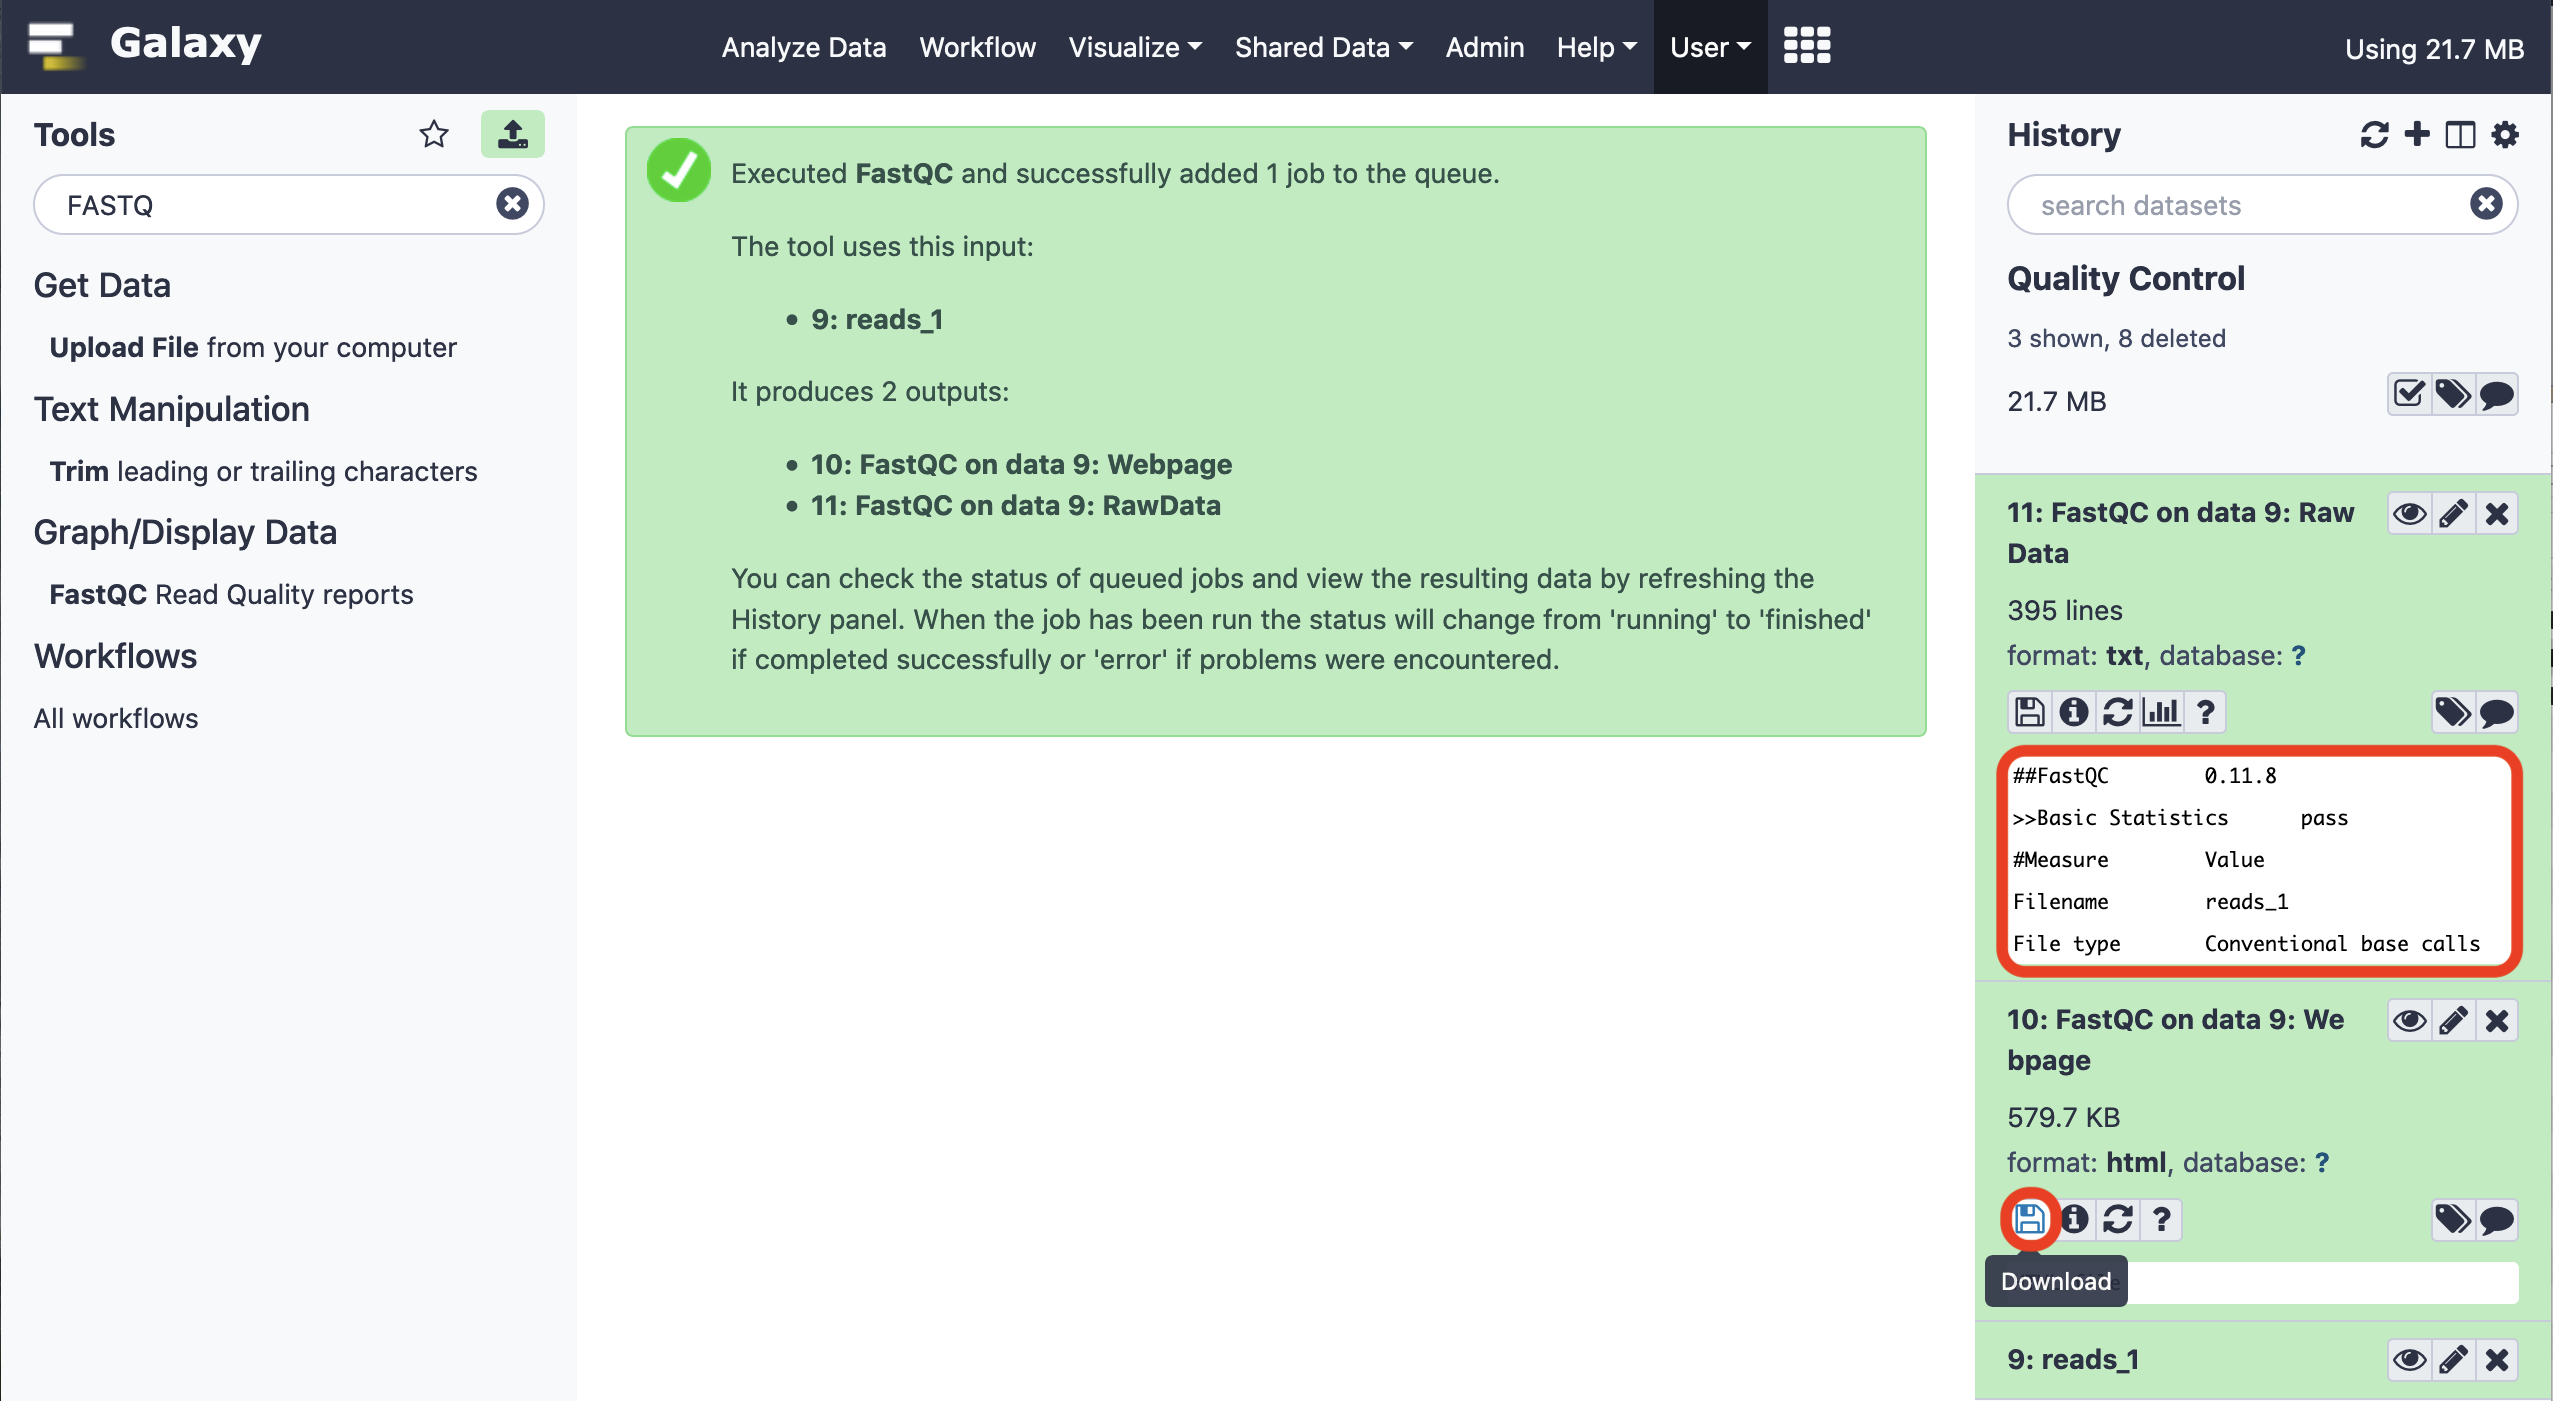
When the job is submitted, the intermediary progress is denoted by an orange/ bisque tinge in the right panel where the task has been highlighted. On completion, it turns into a smooth green.
Visual Inspection of Results
The results are available as raw data (text file) and a formatted HTML visualization file. While both the formats can be downloaded, via the specific icon link, the former could be visualized in the Galaxy interface. The latter has to be explicitly opened in a web-browser to peruse.
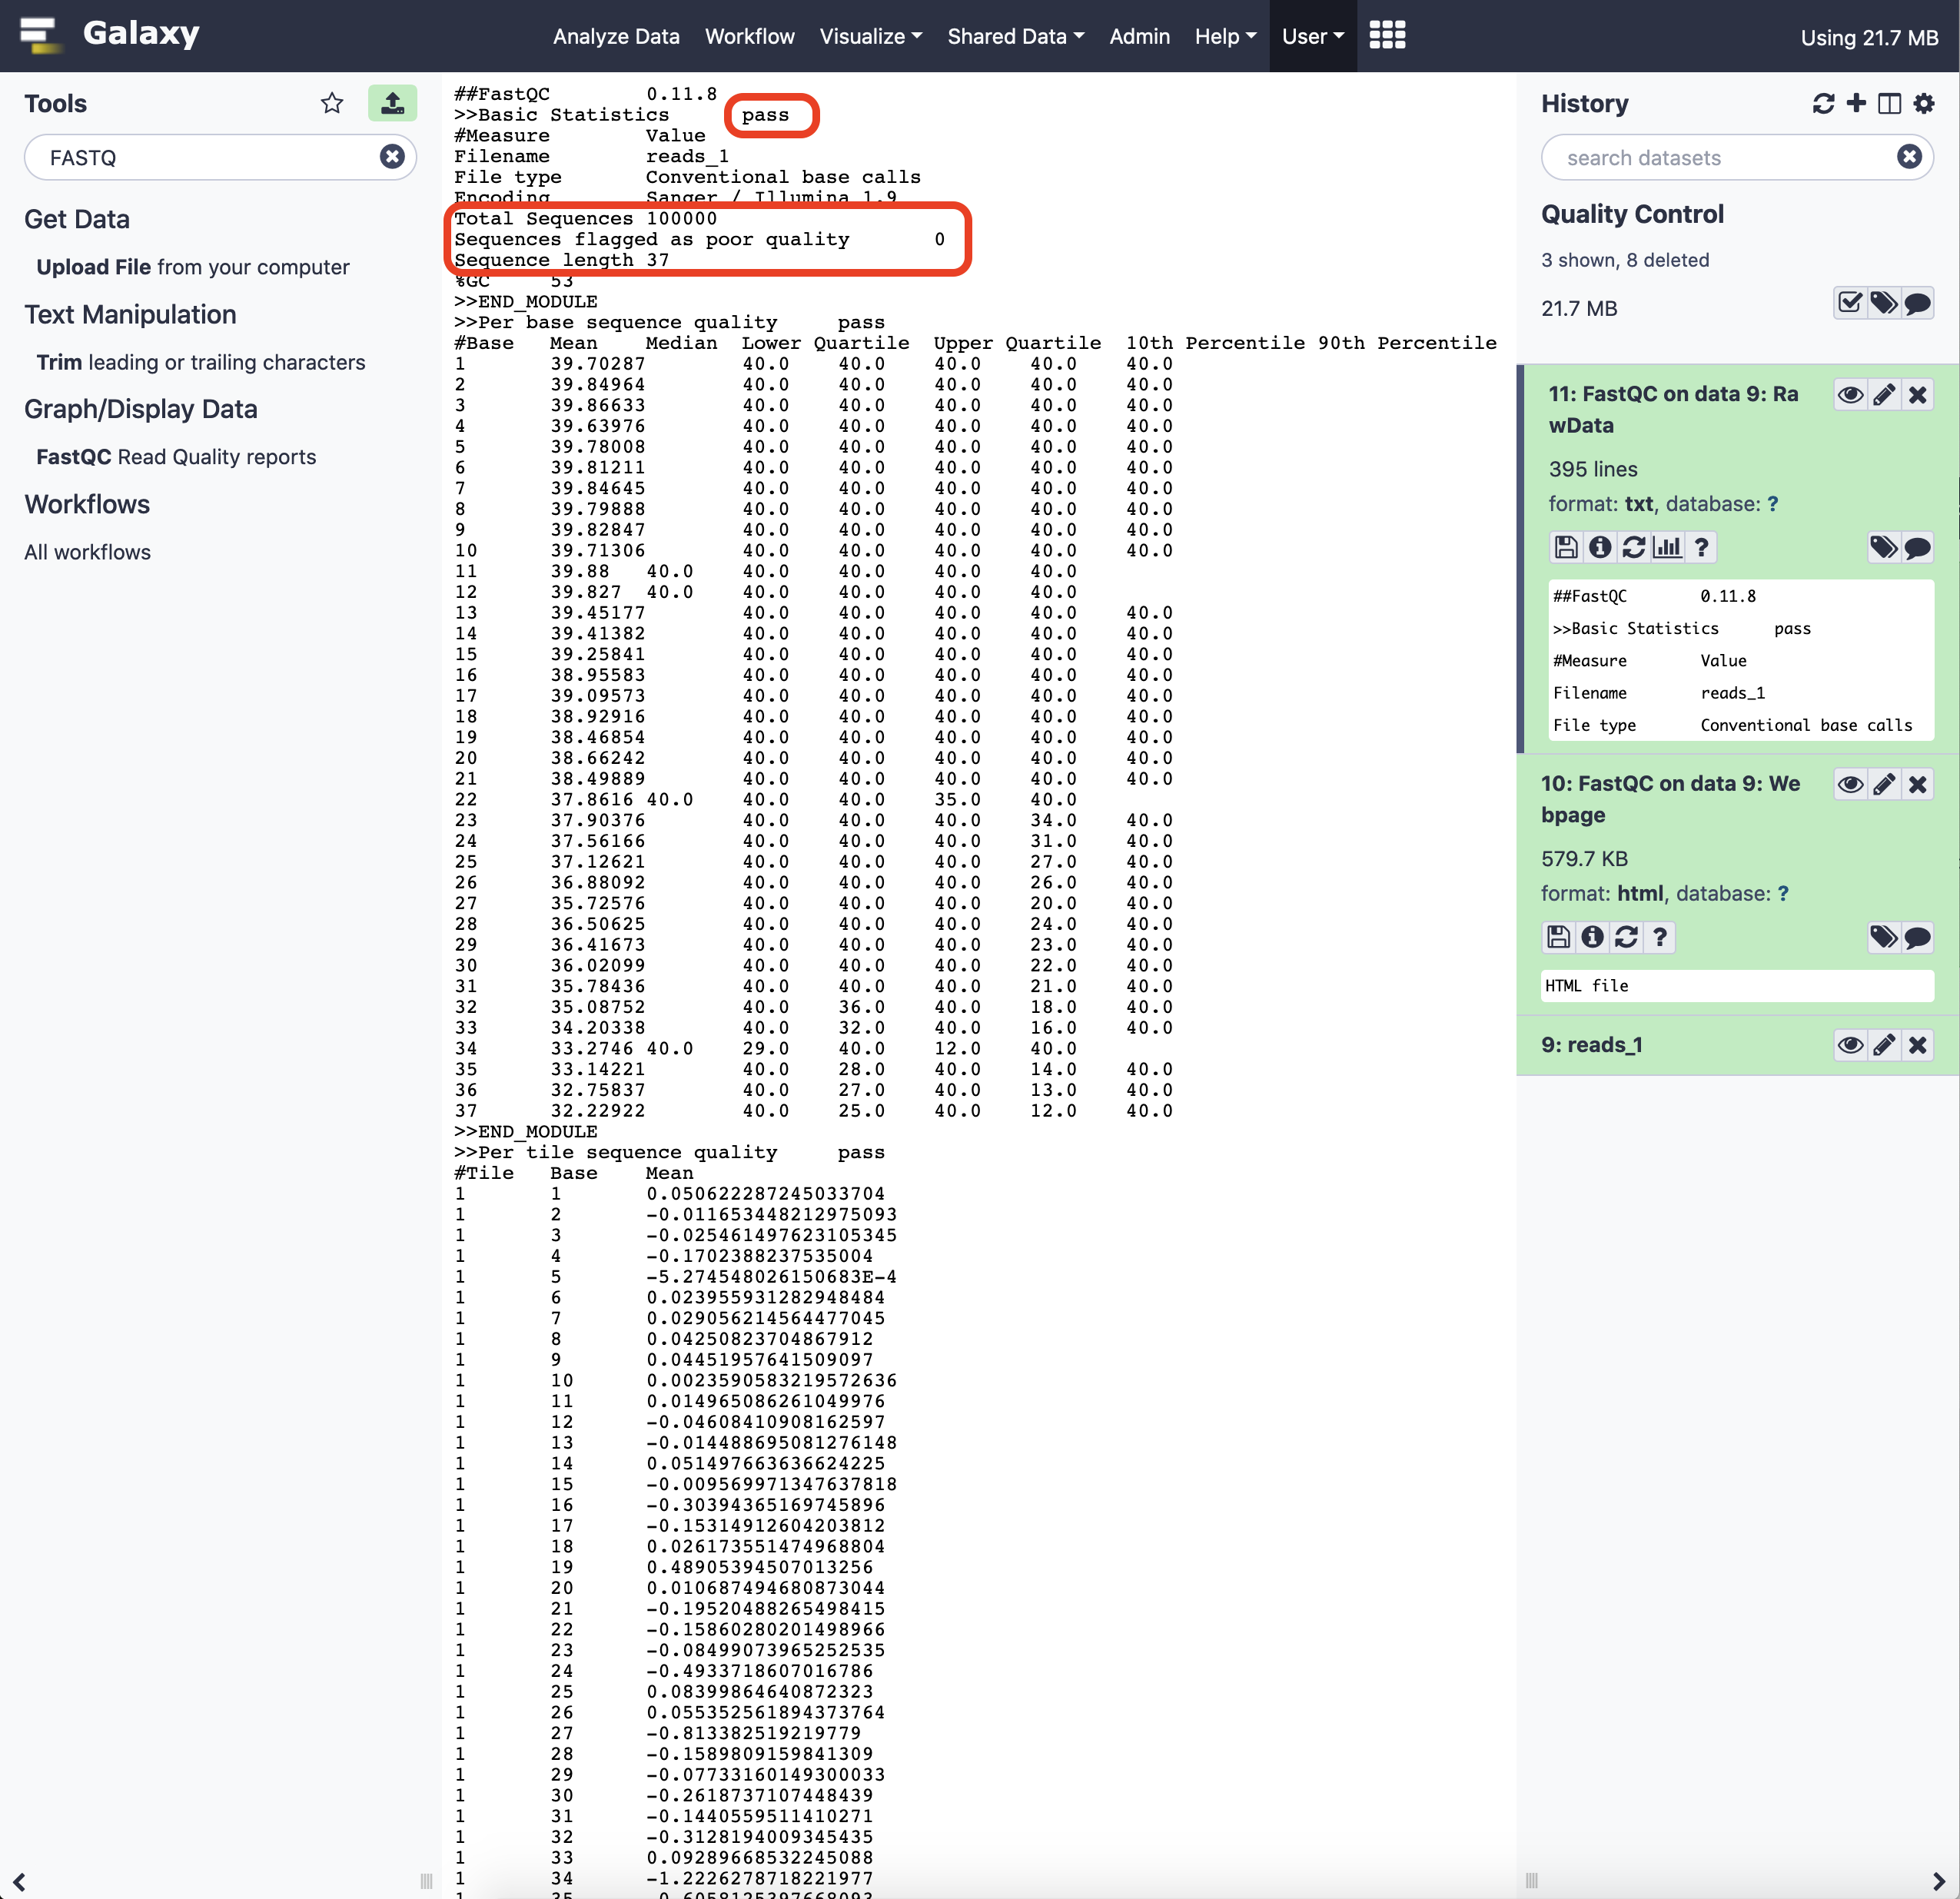
An archive file will be available for download, expanding which we get access to the result data. The HTML results file holds summary plots from FASTQC. Let us review a few of them here.
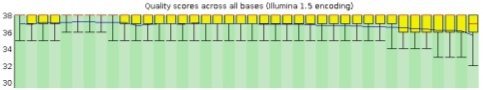
Per Base Sequence Quality
The sequence length inferred by the tool is 37. The following plot has the read-length defined in the x-axis and hence, each position for the base in the read. The y-axis represents the quality scores for each position, that are enlisted with box-plots (A fair description for box-plots is available here ). A quality score is a metric for a base-call; how confident is the sequencer is calling spade a spade.
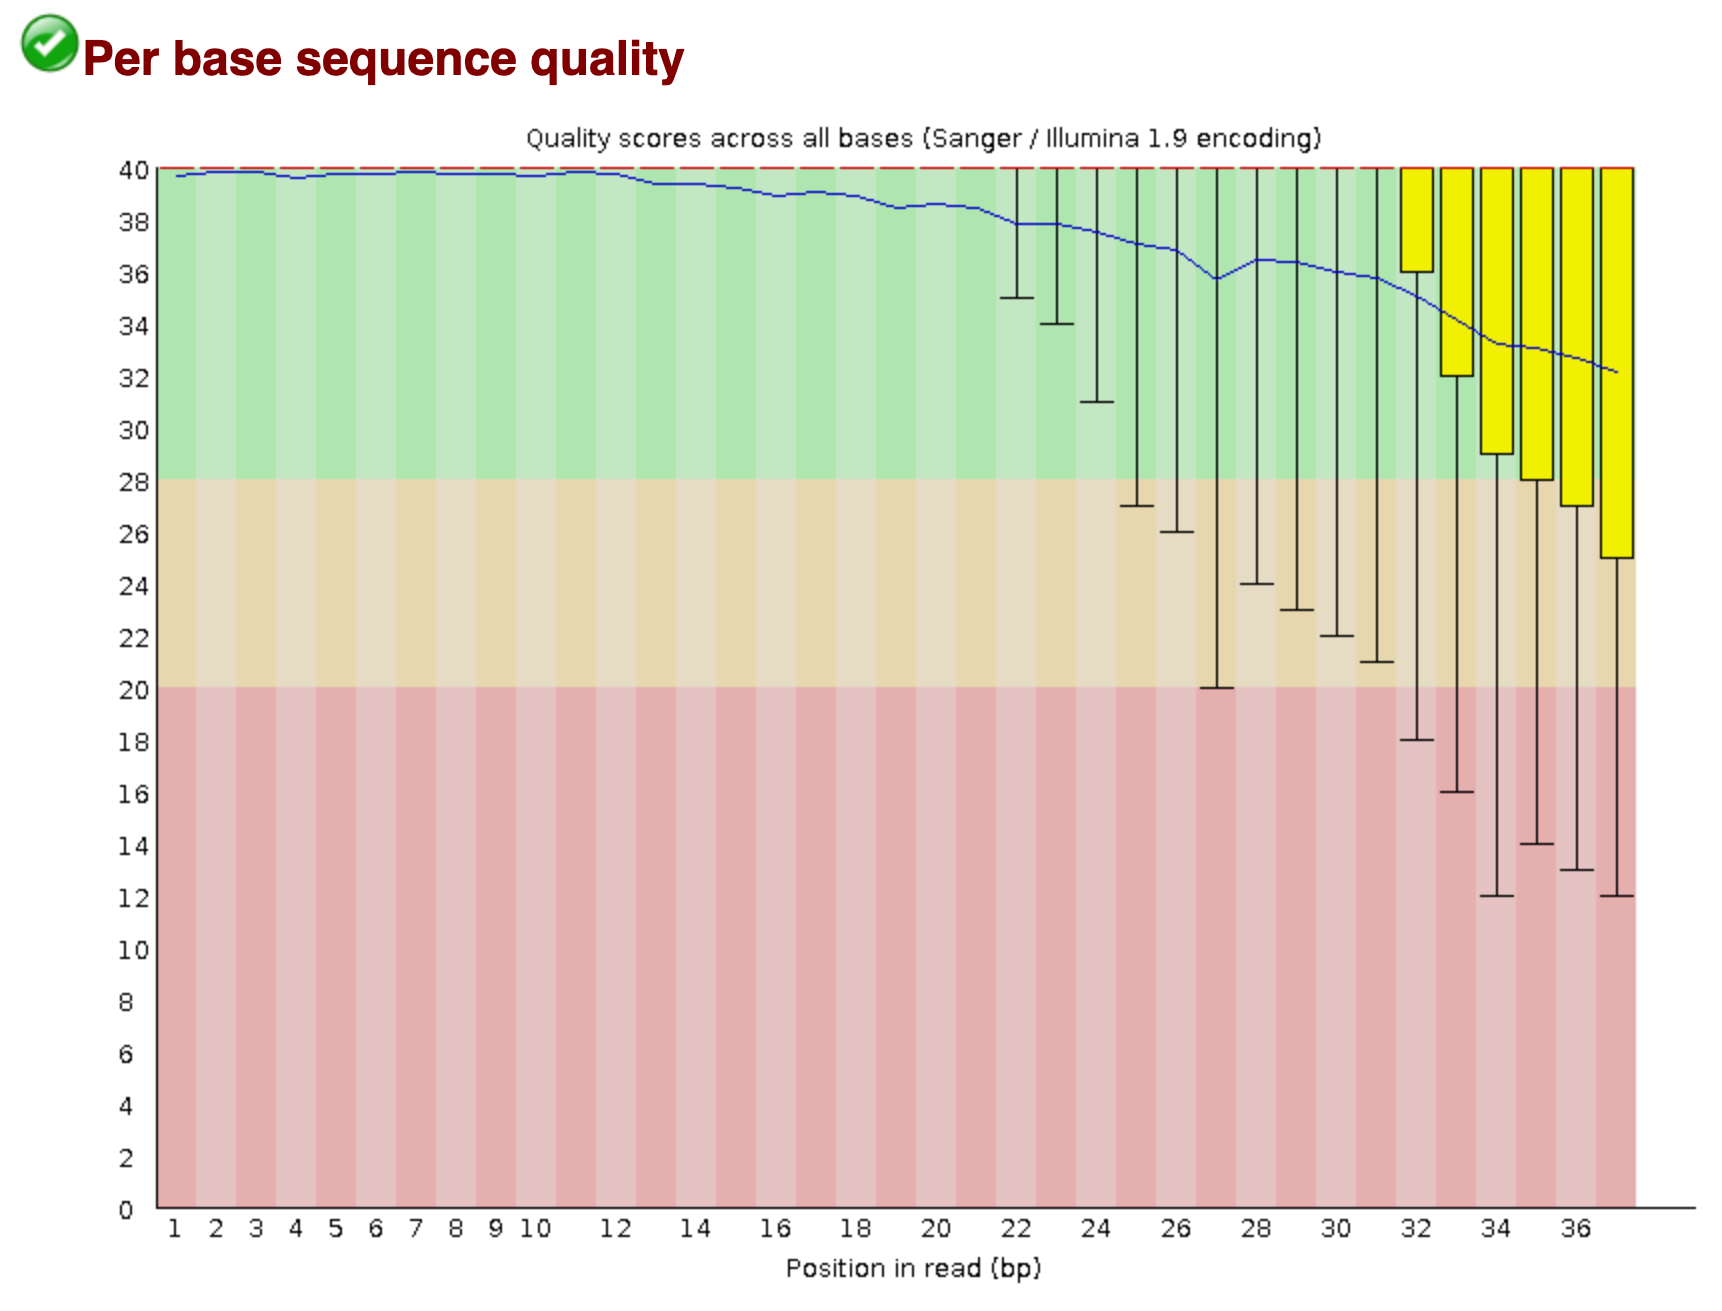
As seen above, the background of the graph is segemented into three distinct, yet intuitive, zones. The "green" zone is reminiscent of a good score (usually a score of 30 is considered an acceptable quantum). The "orange" and "red" zones depict average and poor qualities, respectively. It is also commonly noticed that the quality of the reads tapers at the end. This phenomena can be attributed to signal decay of phasing during a sequencing cycle. A better explanation can be seen here .
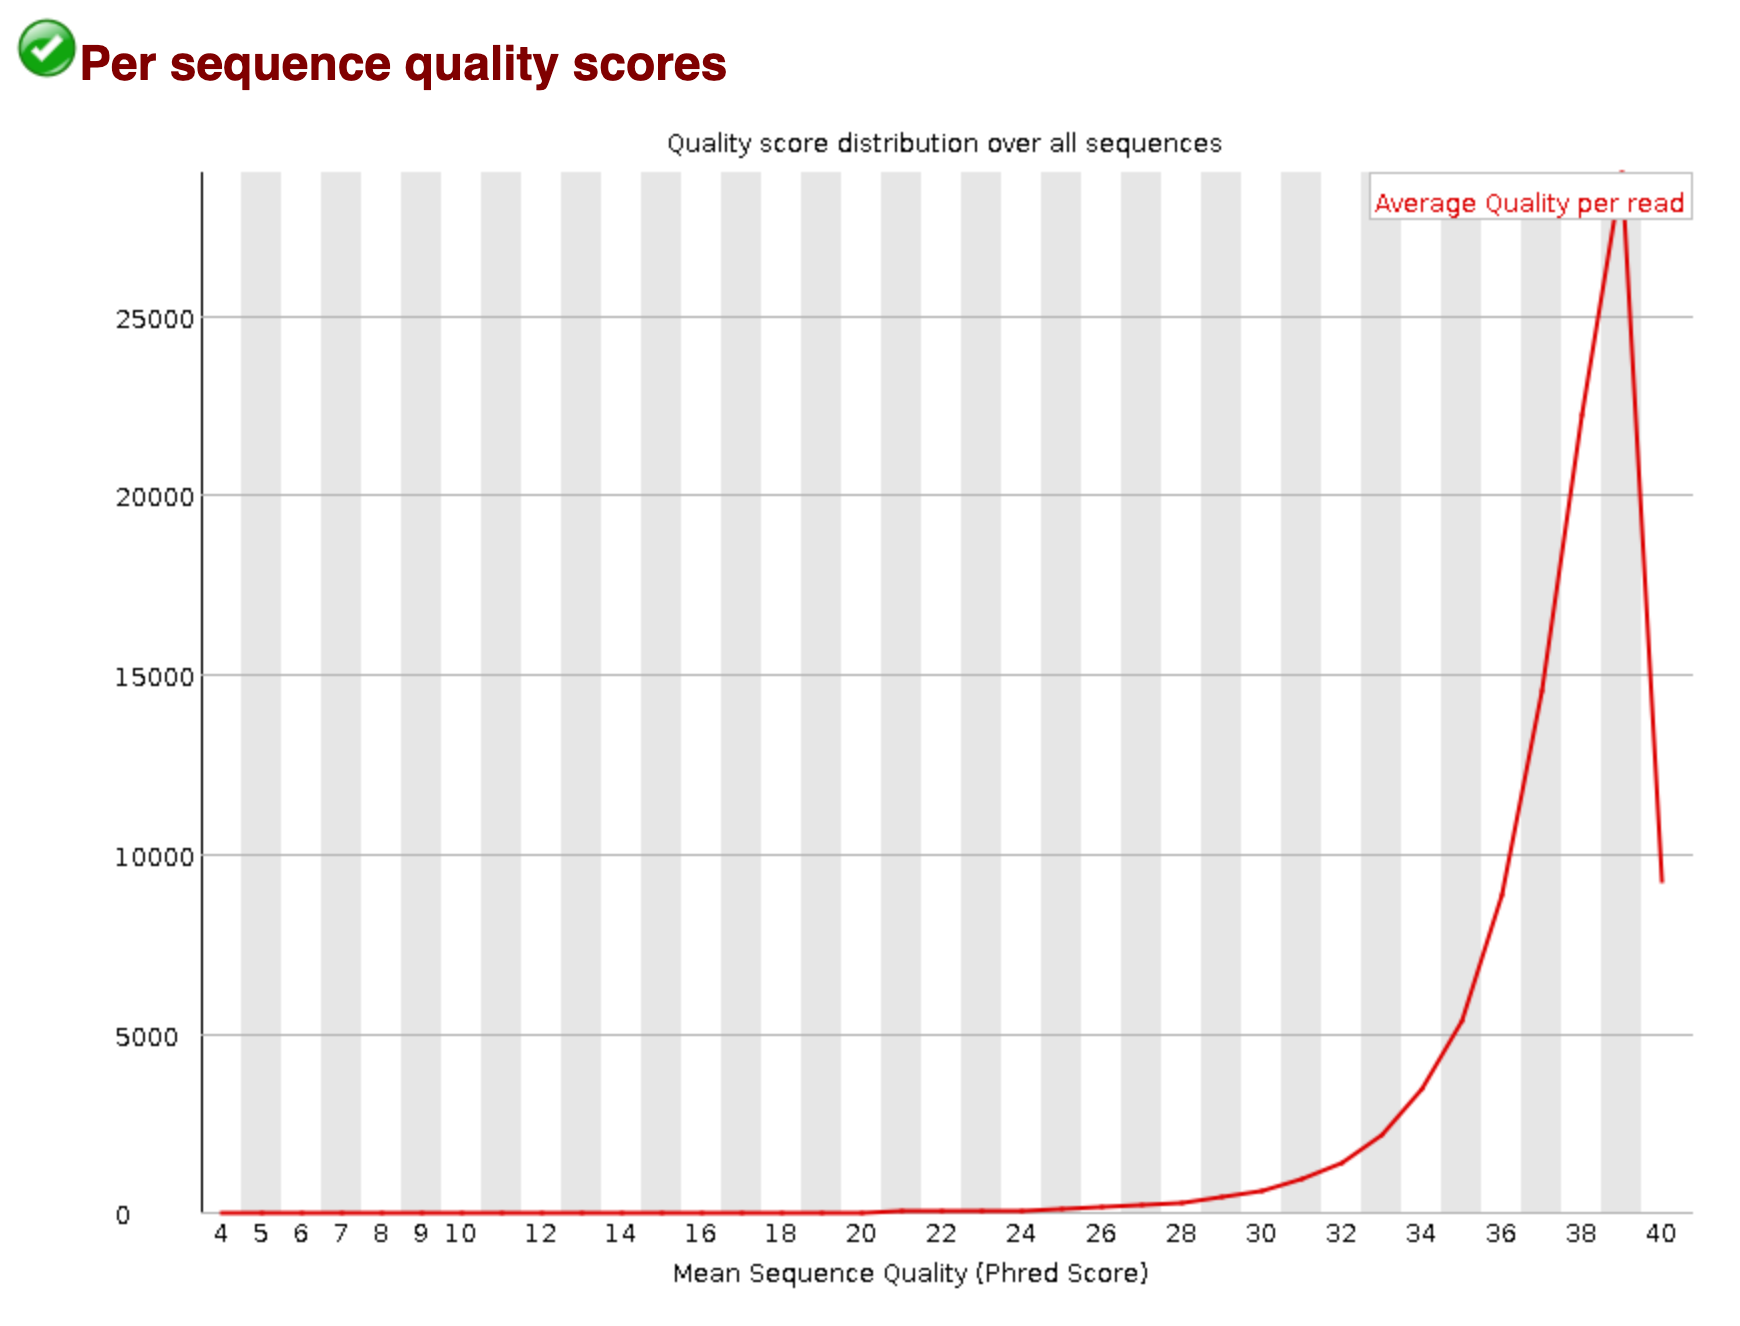
Per Sequence Quality Scores
In contrast to the above plot, this graphic portrays the mean Phred Score for the entire length of a read sequence, for all reads (x-axis), and showcases the number of reads with that score (y-axis). So, while Figure 1 examines a read individually, Figure 2 can be sourced to draw conclusions about the entire set of reads from a sequencing experiment.
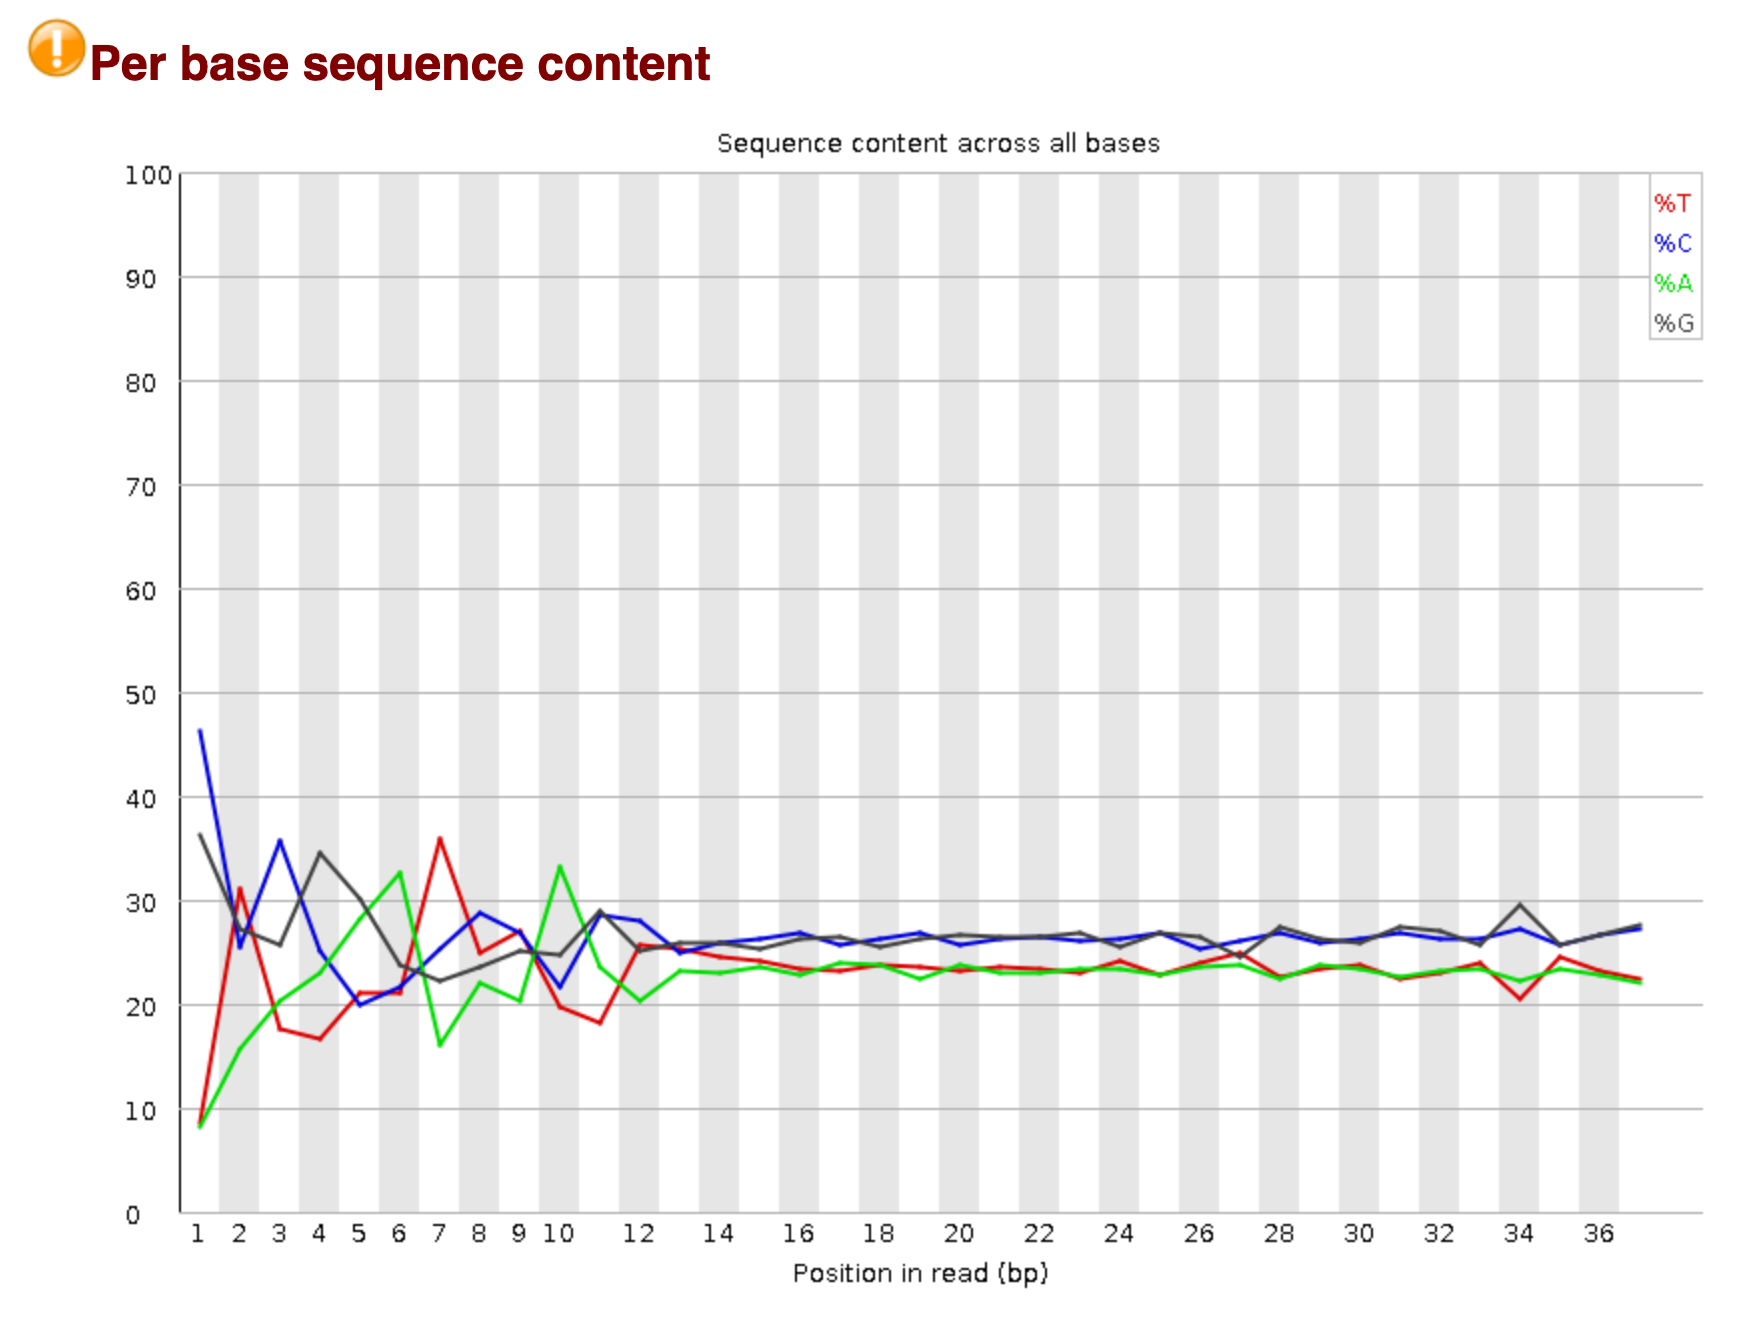
Per Base Sequence Content
The following plot depicts the proportions of Adenine (A), Guanine (G), Thymine (T), and Cytosine (C) at each nucleotide position, across all reads in an input sequence. According to the Chargaff's rule , the usual consequence is that all bases would be aggregately similar in number in a random read, as A always binds to T and G to C. In the current scenario, we find some jitter at the initial part of the read (5' side). This is majorly a technical bias, and can be dealt with by trimming an initial score of nucleotides from the start of the read.
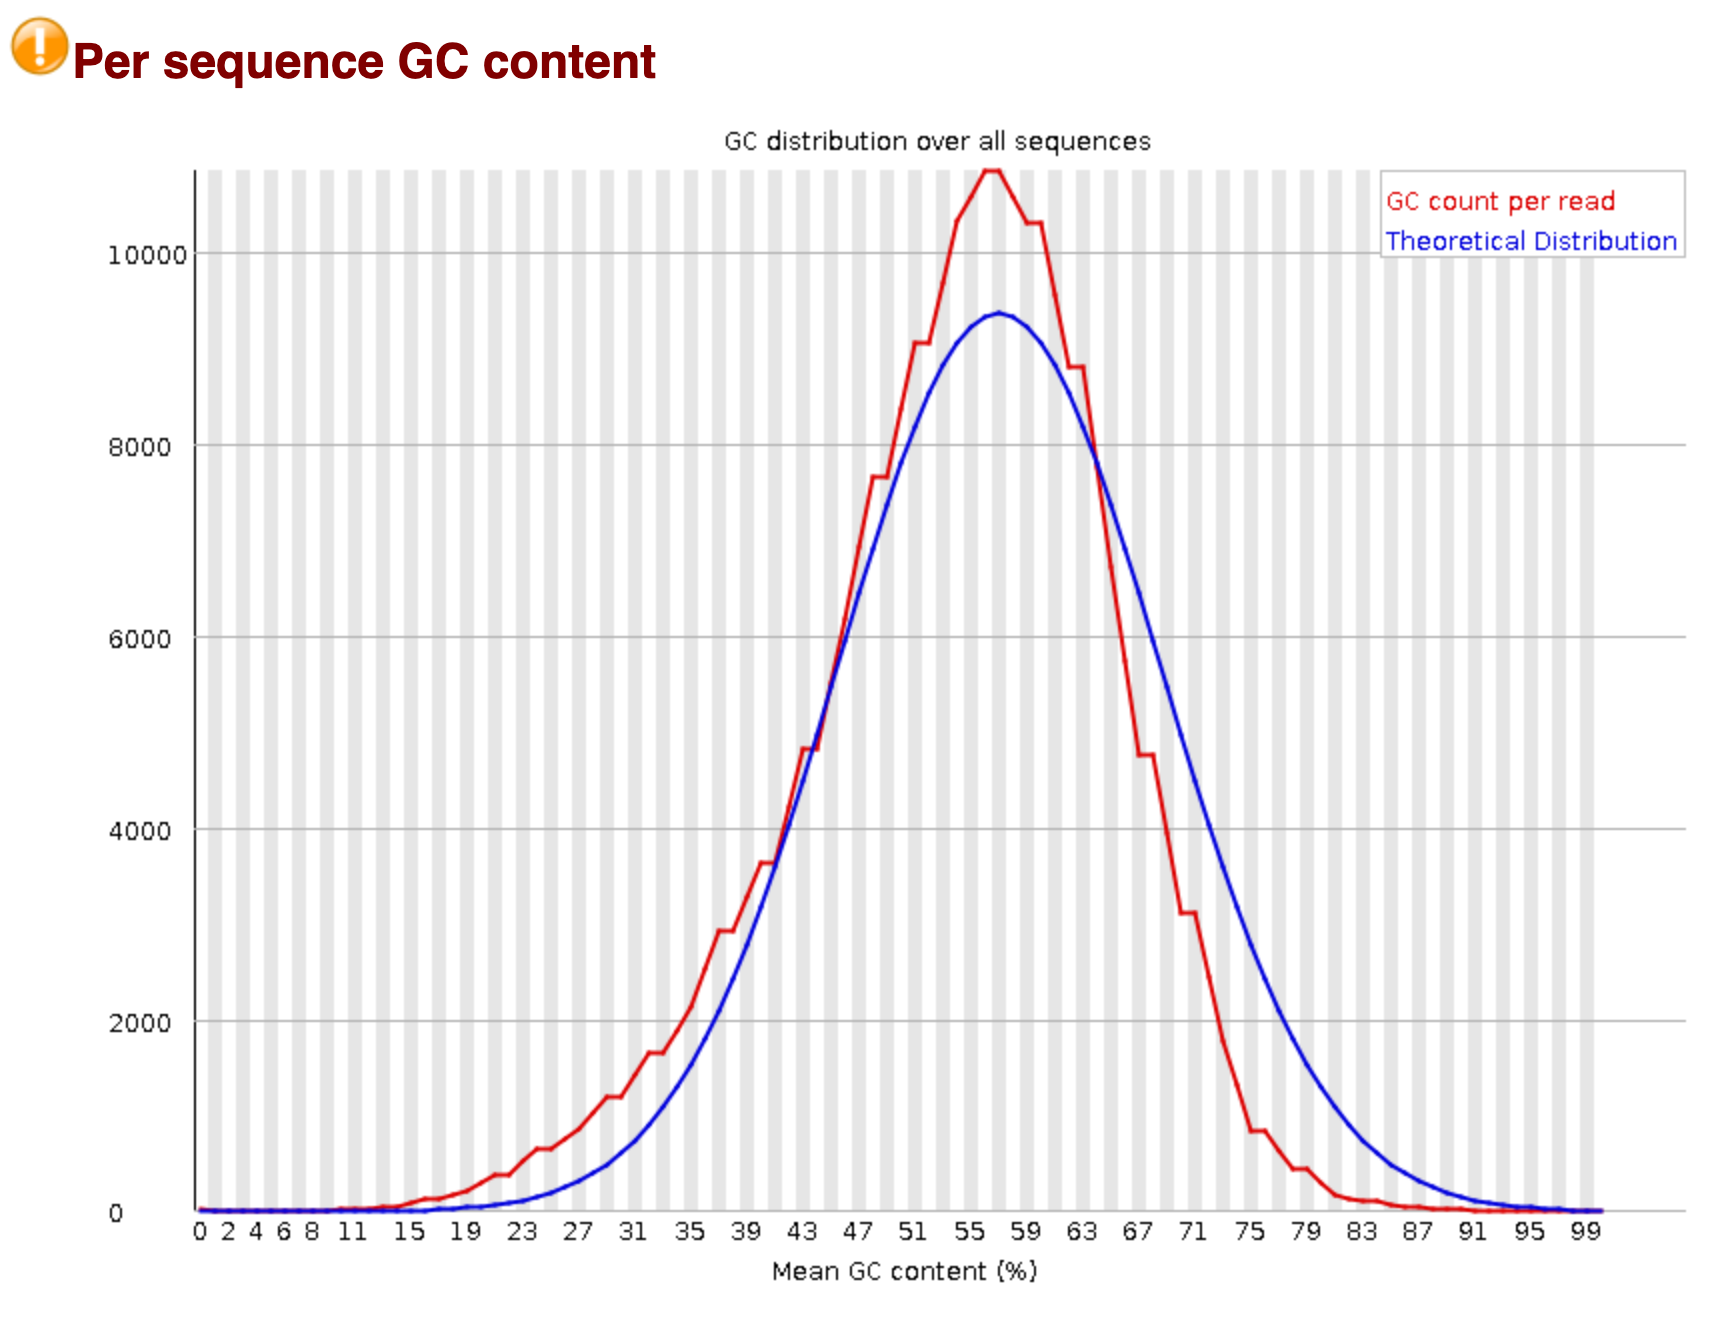
Per Sequence GC Content
The multifaceted significance of the GC content in the genome is well known [1]. As remarked earlier, the theoretical adage is that the percentage of G and C bases shall be uniform for all reads. The following plot depicts the theoretical (blue) and the experimental (red) GC content distribution. The peak signifies the overall GC content in the underlying genome.
P.S. You would also note a warning icon for this and the previous analysis. This might mean some deviation in the expected results, but not a failure. Here, for example, the graph is slightly skewed on the left side and is narrowly higher than the theoretical normal.
Recasting the Reads
Why do we need this? As reported in the section above, we need to rectify the probable abnormalities in the reads. Amongst others, it is required to:
- Remove reads with low quality score and lengths.
- Trim the front- and rear-fractions of the reads with disturbed nucleotide proportions.
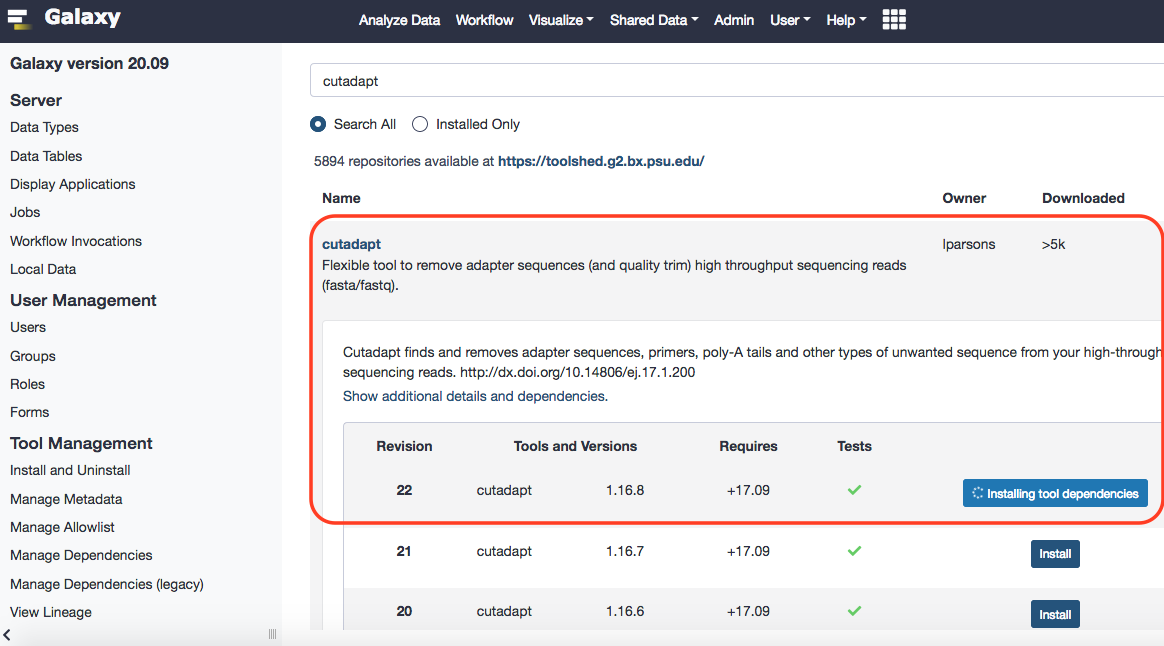
To accomplish these tasks, we shall employ Cutadapt. This tool will allow us to remove adapter sequences in the reads, as well as implement other quality control measures. The results from Cutadapt are fairly comprehensive and easily interpretable.
Before proceeding, we'll have to install this tool in our Galaxy instance. To do that please follow the protocol, as enlisted here . Surely, galaxy will have no initial reference for the tool.
Meanwhile …
Done.
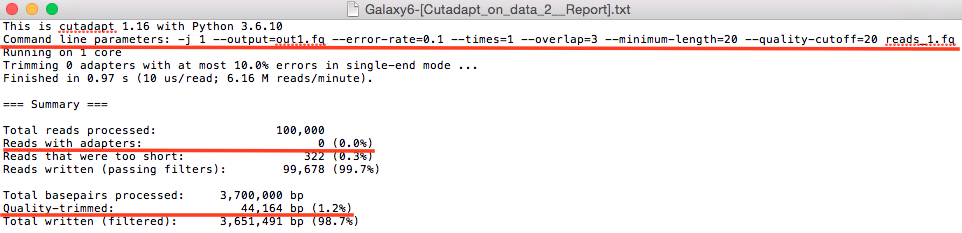
Let us now execute Cutadapt with the following parameters:
- Single-end or Paired-end: Single-end
- Minimum length: 20 (Filter Options)
- Quality cutoff: 20 (Read Modification Options)
- Report: Yes (Output Options)
When finished, download and check the results.
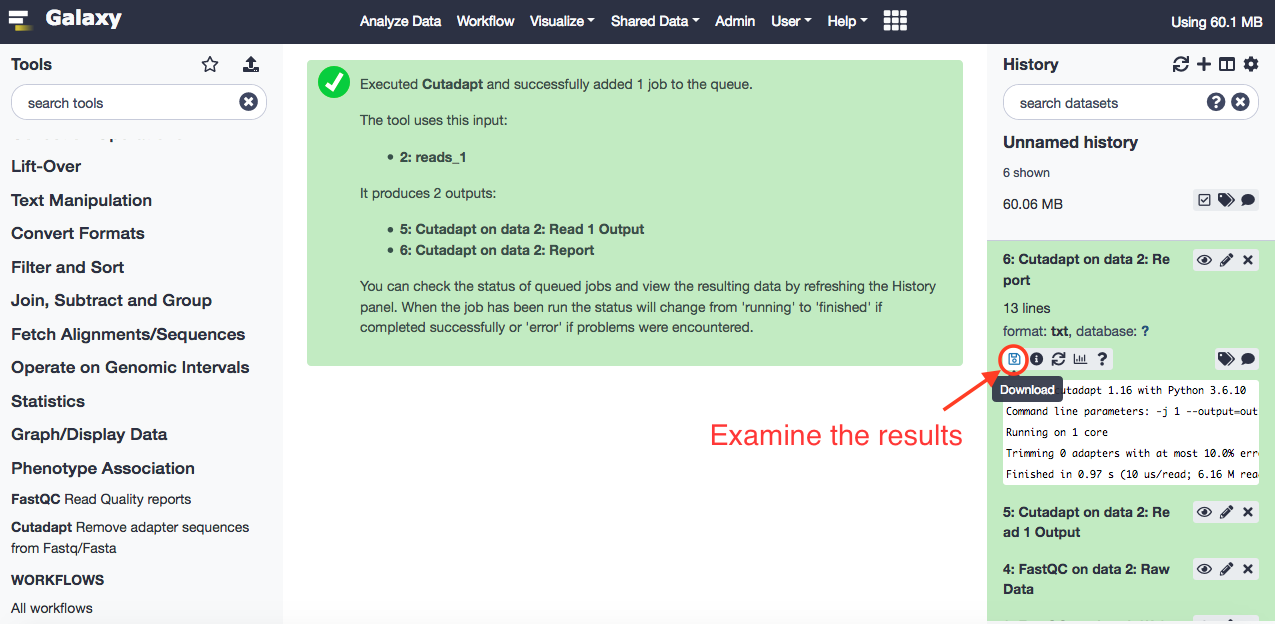
The results show that the data has been pre-normalized and there were no adaptor sequences found (they were already trimmed). There are about 0.3% reads that were filtered that didn't abide by the quality index of 20.
When finished, download and check the results.
Exercise
- Run Fastqc on the filtered data and examine the results.
For illustration purposes, single-end data is a not-so-bad choice. Practically though, we are often confronted with the paired-end data. For both ends of a read sequence, a single-end data means that the sequence has been derived unidirectionally. Contrarily, for paired-end data, that sequence is derived bi-directionally. More condifence can be achieved while working with paired-end data. We would encounter file names ending like _1 and _2 for sequence files for the same segment.

To work with the paired-end data, let us download the other file from the source . As before, rename this file to reads_2 for consistency and re-run the FASTQC for this data now.
Exercise
- Execute Fastqc on reads_2 and compare the results with those of reads_1.
Now we shall re-run the Cutadapt tool with the paired-end reads, i.e. reads_1 and reads_2. Following the similar strategy for parameters as above, for the single-end reads, the only difference will be that we shall select 'Paired-end', that will automatically bring up the option to select two files.
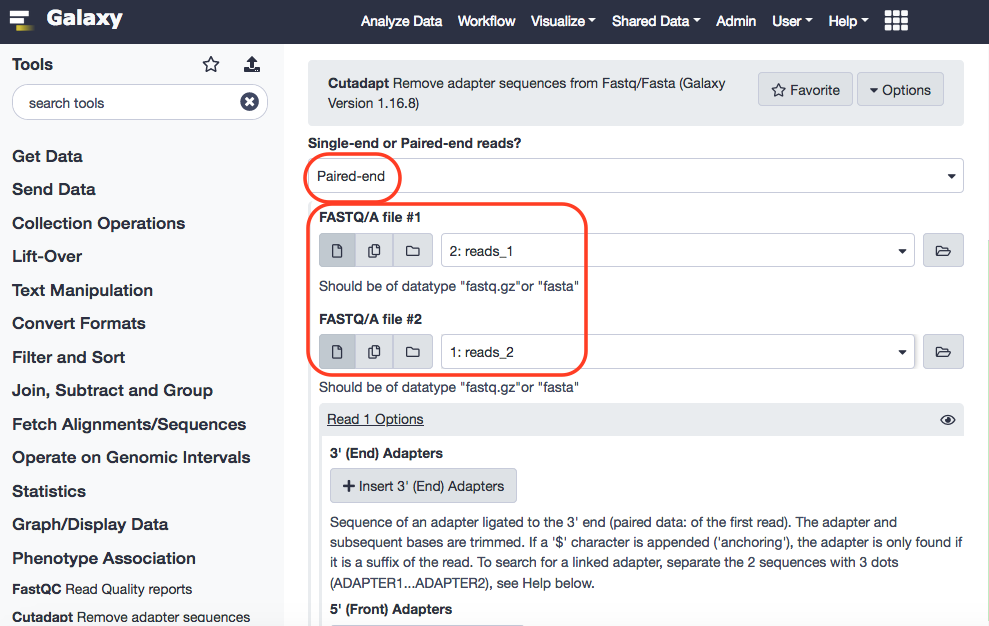
The results are as follows:
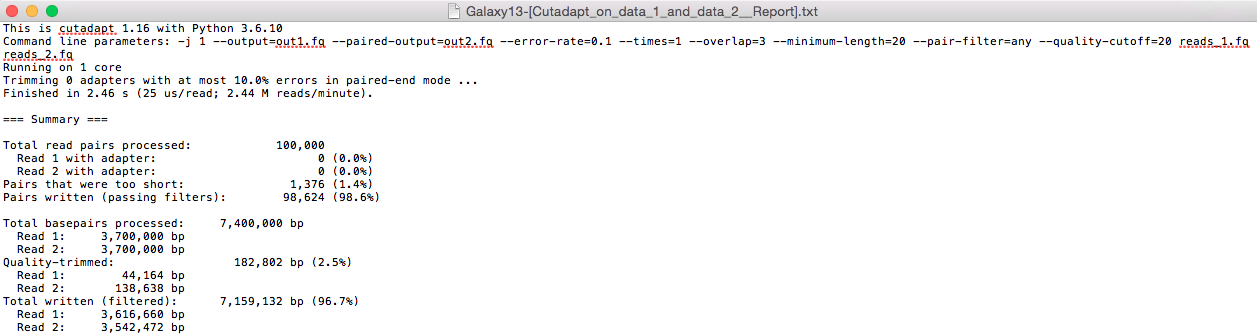
Exercise
- Compare the overall results of Cutadapt with those of reads_1.
- Execute Cutadapt on the FASTQC output data for paired-end reads and analyze the results.
References
- Bérénice Batut, 2020 Quality Control (Galaxy Training Materials). /training-material/topics/sequence-analysis/tutorials/quality-control/tutorial.html Online; accessed Mon Jul 27 2020
- Marie Sémon, Dominique Mouchiroud, Laurent Duret, Relationship between gene expression and GC-content in mammals: statistical significance and biological relevance, Human Molecular Genetics, Volume 14, Issue 3, 1 February 2005, Pages 421–427, https://doi.org/10.1093/hmg/ddi038