Sensitivity and Specificity
There is certain hysteria associated with sensitivty and specificity in the domain of Machine Learning and Data Science. Contrarily, though the idea is pretty straightforward if one has a reasonable understanding about hypothesis testing and statistics.
When we are dealing with a classification problem with a binomial outcome, i.e. disease or not, rich or poor, fail or pass, etc., we have a notion of a positive class and a negative class. This notion is completely arbitrary and solely depends on the problem at hand. For exemplifying, let us assume that a problem has "Pass" as a positive class and "Fail" as a negative class; big surprise !
With the aforementioned background, our definition for sensitivity is a metric that quantifies a method's efficacy to label an instance as "Pass". A method could be a novel one, projected for a comparitive analysis with other methods, an underlying theory that defines a label based on some features/ variables, or even a proposed hypothesis that given a set of attributes (say marks in several subjects, here) a candidate is declared "Pass" or "Fail". Mathematically, sensitivity is defined as the ratio of True Positives and the Total Positives.
Sensitivity = True Positives ⁄ Total Positives
OR
Sensitivity ≡True Positives ⁄ (True Positives + False Positives)
Specificity, on the other hand, determines a method's capability of highlighting the negative classes. If "Pass" is considered a positive label, then definitely "Fail" is a negative class.
Specificity = True Negatives ⁄ Total Negatives
OR
Specificity ≡True Negatives ⁄ (True Negatives + False Negatives)
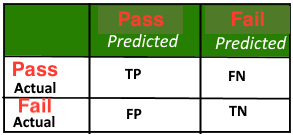
A confusion matrix is often a ready-reckoner for these values, as illustrated below.

Ideally, we expect high values of both sensitivity and specificity. Another metric that encompasses these two parameters, so as to engender a grander view of a tool's performance is Area Under Curve (AUC) of Reciever Operator Charactersitic (ROC) curve. So, greater the area, the better it is.
